CATEGORY INSIGHTS
Find out what’s driving sales in Amazon’s Toys & Games category.
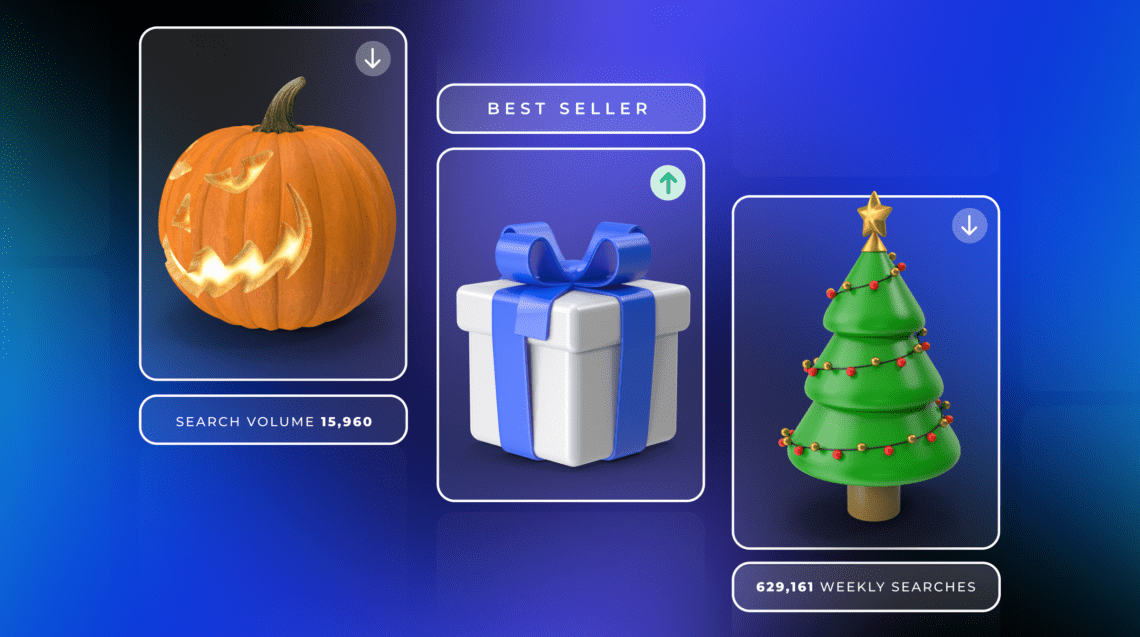
Get brand new data on the trends, pricing strategies, and other factors impacting sales for toys and games brands on Amazon. Featuring expert tips for maximizing sales in the Toys & Games category during the holidays.
Access the report
Key insights

Price reductions prove effective in boosting sales. Data shows that well-timed price adjustments can lead to sustained or growing sales, with some products experiencing 50%+ sales growth coinciding with price drops.

Changing consumer preferences are driving growth. Shifts in consumer preferences are driving growth in certain niches, with sales of some products growing 25% over the past quarter.
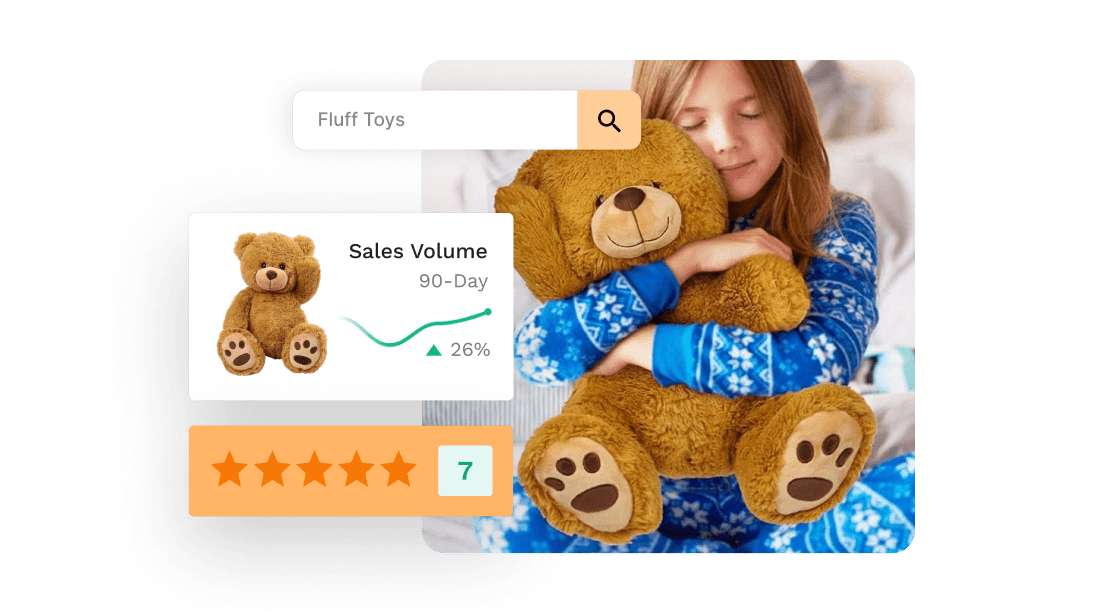
Consumer engagement is growing. Consumer engagement in the Toys & Games category is increasing, with 20%+ year-over-year growth in reviews for some product niches.
See which trends can increase your sales in Amazon’s Toys & Games category.
Download the reportRelated Resources


About the Report
Methodology
This report covers comprehensive insights into the U.S. Toys & Games market, with data reflecting estimates based on a sampling of approximately 20,000 products within each niche covered in this report. Year-over-year trends reflect July 18, 2023 – July 16, 2024, compared to July 17, 2022 – July 17, 2023; August 6, 2023 – August 4, 2024, compared to August 5, 2022 – August 5, 2023; and August 26, 2023 – August 24, 2024, compared to August 25, 2022 – August 25, 2023. 90-day trends reflect April 18, 2024 – July 16, 2024, compared to January 18, 2024 – April 17, 2024; May 7, 2024 – August 4, 2024, compared to February 6, 2024 – May 6, 2024; and May 26, 2024 – August 24, 2024, compared to February 25, 2024 – May 25, 2024. 30-day trends reflect June 17, 2024 – July 16, 2024, compared to Mary 17, 2024 – June 16, 2024; July 6, 2024 – August 4, 2024, compared to June 5, 2024 – July 5, 2024; and July 25, 2024 – August 24, 2024, compared to June 25, 2024 – July 25, 2024.
Using the data
We encourage you to share, reference, and publish this report’s findings with attribution to “Jungle Scout Cobalt” and a link to this page.
For requests or media assets, contact [email protected].
Jungle Scout for Sellers & SMBs
Jungle Scout is the leading platform for first-time and established ecommerce sellers, supporting more than $50 billion in annual Amazon revenue. Founded in 2015 as the first Amazon product research tool, Jungle Scout today features a full suite of best-in-class business management and market intelligence solutions to help sellers jumpstart and grow their ecommerce business.
Jungle Scout for Brands & Retailers
Jungle Scout Cobalt empowers brands and retailers with a powerful suite of ecommerce tools designed to drive growth, maximize sales, and optimize digital shelf performance on Amazon. Comprehensive data analytics, built-in advertising automation, and intuitive visualizations provide straightforward answers to critical ecommerce questions, turning insights into action.
Jungle Scout Data Cloud gives big box retailers and investors access to millions of Amazon data points including sales estimates, historical search volume, share of voice, product insights, and more. Data Cloud offers needed scalability and flexibility by providing a way to get Jungle Scout’s industry-leading data, with the ability to analyze and visualize that data using the tools of their choice.