AMAZON UNLOCKED
Amazon Market Data: Health & Home Brands
Learn how 12 leading health and home brands – including Vital Proteins, Craftsman, Husqvarna, and more – are performing on Amazon. Data on sales trends, pricing changes, top-selling products, and more.
Access the report
Key Takeaways
Market dynamics are shifting.
First-party sales saw an average 23% year-over-year increase in sales across Health & Home related categories. Find out which brands have seen the largest shift.
Seasonality leads to higher prices.
Despite economic headwinds, the average sale price across Health & Home categories declined just 4% year-over-year. Learn which brands are increasing and decreasing their prices.
Consumer engagement is up.
Reviews per product grew 9% year-over-year, with 8 of 12 brands seeing increases. See which brand gained nearly 50% more reviews this year.
Key takeaways

Prices are trending down. The average price in this niche has fallen 5% in the last year — find out what that means for market share leaders and beyond.

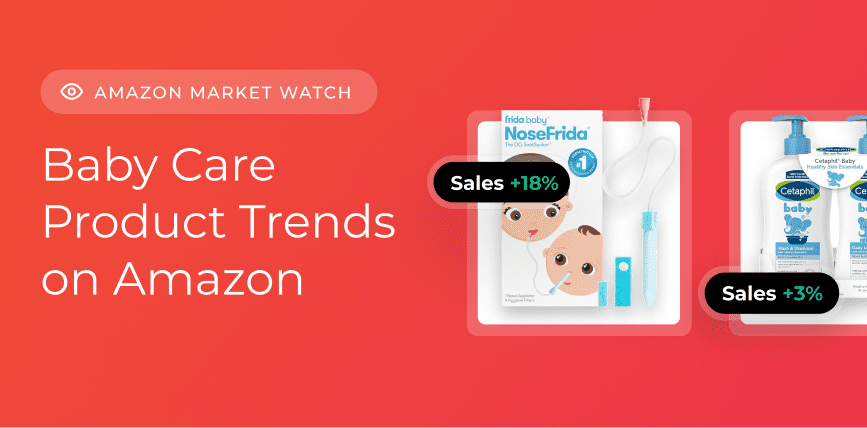
High-volume keywords are in play for new competitors. Explore the most popular searches related to nursery products and discover low-competition keywords to target.

Specific product trends are emerging. See which product has garnered more than 15 million searches in 30 days.
Benchmark Amazon performance and get info on your competitors
Download the reportRelated Resources
About the Report
Methodology
Unless otherwise noted, data represents the U.S. market and reflects estimates based on a sampling of data within Amazon’s Health & Household; Tools & Home Improvement; and Patio, Lawn & Garden categories. Year-over-year trends reflect the period of August 14, 2023 – August 14, 2024, compared to August 13, 2022 – August 13, 2023. Quarter-over-quarter trends reflect the period of April 1, 2024 – June 30, 2024, compared to January 1, 2024 – March 31, 2024. 30-day trends reflect the period of July 15, 2024 – August 14, 2024, compared to June 14, 2024 – July 14, 2024.
Using the data
We encourage you to share, reference and publish this report’s findings with attribution to “Jungle Scout Cobalt” and a link to this page.
For more information, specific data requests, media assets, or to reach the report’s authors, please contact us at [email protected].
Jungle Scout for Sellers & SMBs
Jungle Scout is the leading platform for first-time and established ecommerce sellers, supporting more than $50 billion in annual Amazon revenue. Founded in 2015 as the first Amazon product research tool, Jungle Scout today features a full suite of best-in-class business management and market intelligence solutions to help sellers jumpstart and grow their ecommerce business.
Jungle Scout for Brands & Retailers
Jungle Scout Cobalt empowers brands and retailers with a powerful suite of ecommerce tools designed to drive growth, maximize sales, and optimize digital shelf performance on Amazon. Comprehensive data analytics, built-in advertising automation, and intuitive visualizations provide straightforward answers to critical ecommerce questions, turning insights into action.
Jungle Scout Data Cloud gives big box retailers and investors access to millions of Amazon data points including sales estimates, historical search volume, share of voice, product insights, and more. Data Cloud offers needed scalability and flexibility by providing a way to get Jungle Scout’s industry-leading data, with the ability to analyze and visualize that data using the tools of their choice.