CATEGORY INSIGHTS
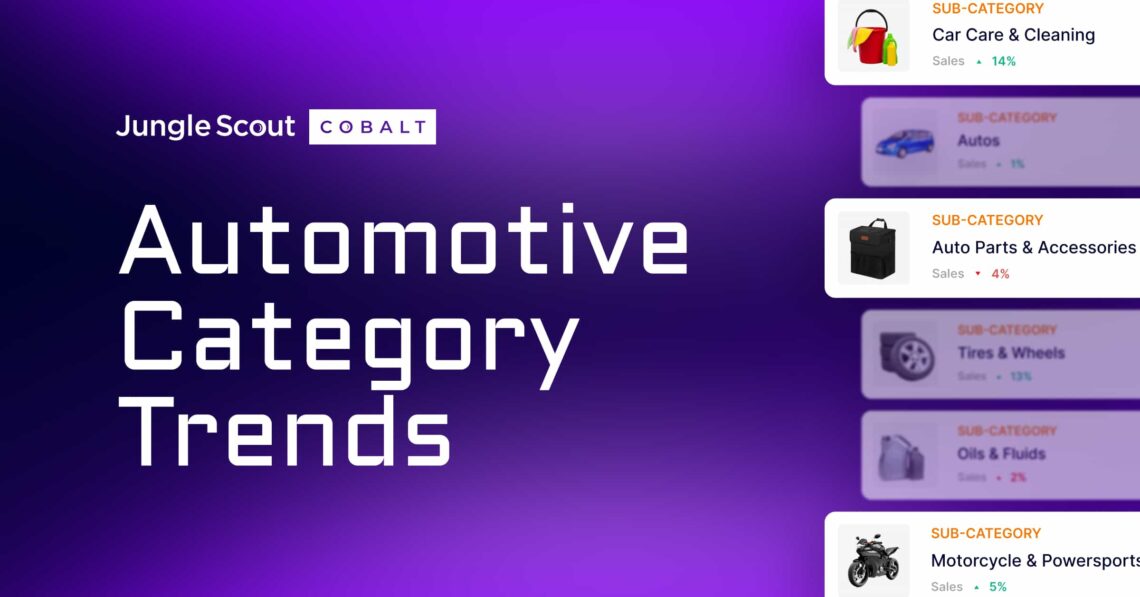
Find out what’s driving sales in Amazon’s Automotive category.
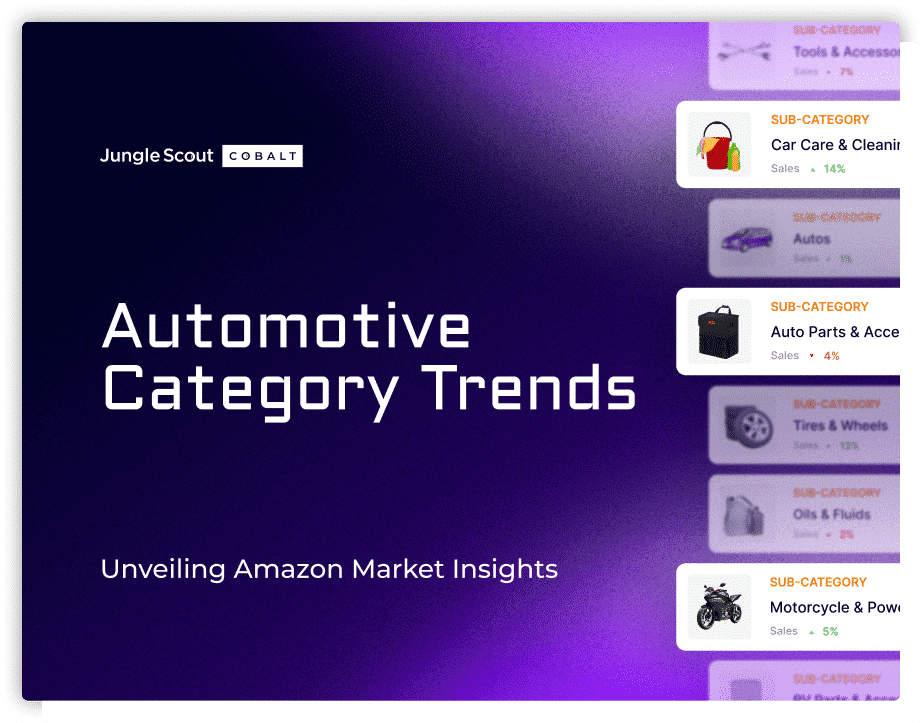
Learn about the trends, pricing strategies, and other factors that are influencing purchase behavior in Amazon’s Automotive category. Data on car cleaning products, automotive accessories, racing gear, and more.
Access the report
Key Takeaways
3P sellers dominate key niches, creating strategic opportunities.
Third-party sellers are critical players in this category, generating 60%+ of the revenue across multiple niches. Learn how this can unlock competitive advantages.
Pricing strategies drive revenue growth.
Strategic pricing is a key growth lever for Automotive brands on Amazon, driving 15 – 20% unit sales and revenue increases in some niches. See which pricing strategies are most impactful.
Fragmented market share offers growth potential for emerging brands.
Without dominant leaders, some niches offer significant room for new players to grow. Find out which new entrant grew market share by nearly 10% in less than a year.
Find new opportunities in Amazon’s Automotive category.
Download the reportRelated Resources

About the Report
Methodology
This report covers comprehensive insights into the U.S. Automotive market, with estimates based on a sampling of ~20,000 products in each niche. Year-over-year trends reflect Oct. 28, 2023 – Oct. 26, 2024, compared to Oct. 28, 2022 – Oct. 27, 2023; Jan. 1, 2024 – Nov. 26, 2024, compared to Jan. 1, 2023 – Nov. 26, 2023; and Jan. 1, 2024 – Dec. 31, 2024, compared to Jan. 1, 2023 – Dec. 31, 2023. 90-day trends reflect Aug. 12, 2024 – Nov. 9, 2024, compared to May 14, 2024 – Aug. 11, 2024; Aug. 26, 2024 – Nov. 23, 2024, compared to May 27, 2024 – Aug. 25, 2024; and Sept. 30, 2024 – Dec. 28, 2024, compared to June 22, 2024 – Sept. 29, 2024. 30-day trends reflect Oct. 11, 2024 – Nov. 9, 2024, compared to Sept. 10, 2024 – Oct. 9, 2024; Oct. 25, 2024 – Nov. 23, 2024, compared to Sept. 24, 2024 – Oct. 24, 2024; and Nov. 29, 2024 – Dec. 28, 2024, compared to Oct. 29, 2024 – Nov. 28, 2024. Advertising data represents data for Q1 – Q3 2024 for 500+ distinct brands and 11,000+ unique advertising campaigns.
Using the data
We encourage you to share, reference, and publish this report’s findings with attribution to “Jungle Scout” and a link to this page.
For more information, specific data requests or media assets, or to reach the report’s authors, please contact us at [email protected].
Jungle Scout for brands & retailers
Jungle Scout Cobalt empowers brands and retailers with a powerful suite of ecommerce tools designed to drive growth, maximize sales, and optimize digital shelf performance on Amazon. Comprehensive data analytics, built-in advertising automation, and intuitive visualizations provide straightforward answers to critical ecommerce questions, turning insights into action.
Jungle Scout Data Cloud gives big box retailers and investors access to millions of Amazon data points including sales estimates, historical search volume, share of voice, product insights, and more. Data Cloud offers needed scalability and flexibility by providing a way to get Jungle Scout’s industry-leading data, with the ability to analyze and visualize that data using the tools of their choice.
Jungle Scout for sellers & SMBs
Jungle Scout is the leading platform for first-time and established ecommerce sellers, supporting more than $50 billion in annual Amazon revenue. Founded in 2015 as the first Amazon product research tool, Jungle Scout today features a full suite of best-in-class business management and market intelligence solutions to help sellers jumpstart and grow their ecommerce business.
Jungle Scout Competitive Intelligence helps sellers and brand owners identify and outperform key competitors on Amazon, ensuring that every minute and dollar invested in their business is focused on effectively increasing sales.