Table of Contents
Getting started with Competitive Intelligence
Content
expand_moreTable of Contents
Getting started with Competitive Intelligence
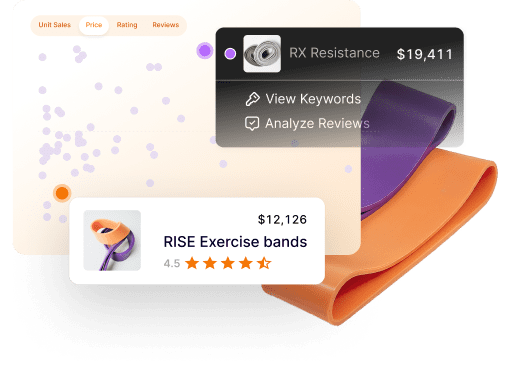
With Jungle Scout’s new Competitive Intelligence tool, sellers and brand owners can create a market segment and view comprehensive trends in revenue, unit sales, prices, reviews, and star ratings within your competitive market.
Competitive Intelligence displays a detailed visual layout to see how your products stack up against competitors.
Let’s say I am a golf brand looking to launch new products. I can use Competitive Intelligence to take a look at the top competitors in a new market I’d like to enter. With the information provided, I can make an informed decision about how to price my product, the keywords I should target, and the top competitors.
Are you interested in seeing how the tool works? Keep reading to learn how to use Competitive Intelligence to compare your product performance to the competition.
Getting started with Competitive Intelligence
Competitive Intelligence provides Amazon sellers with comprehensive data points on their competitors to help them make informed decisions about their business.
When you create a competitive segment, the tool automatically identifies up to 200 of the closest competitors based on keyword overlap.
Let me show you how it works.
Creating a competitive segment
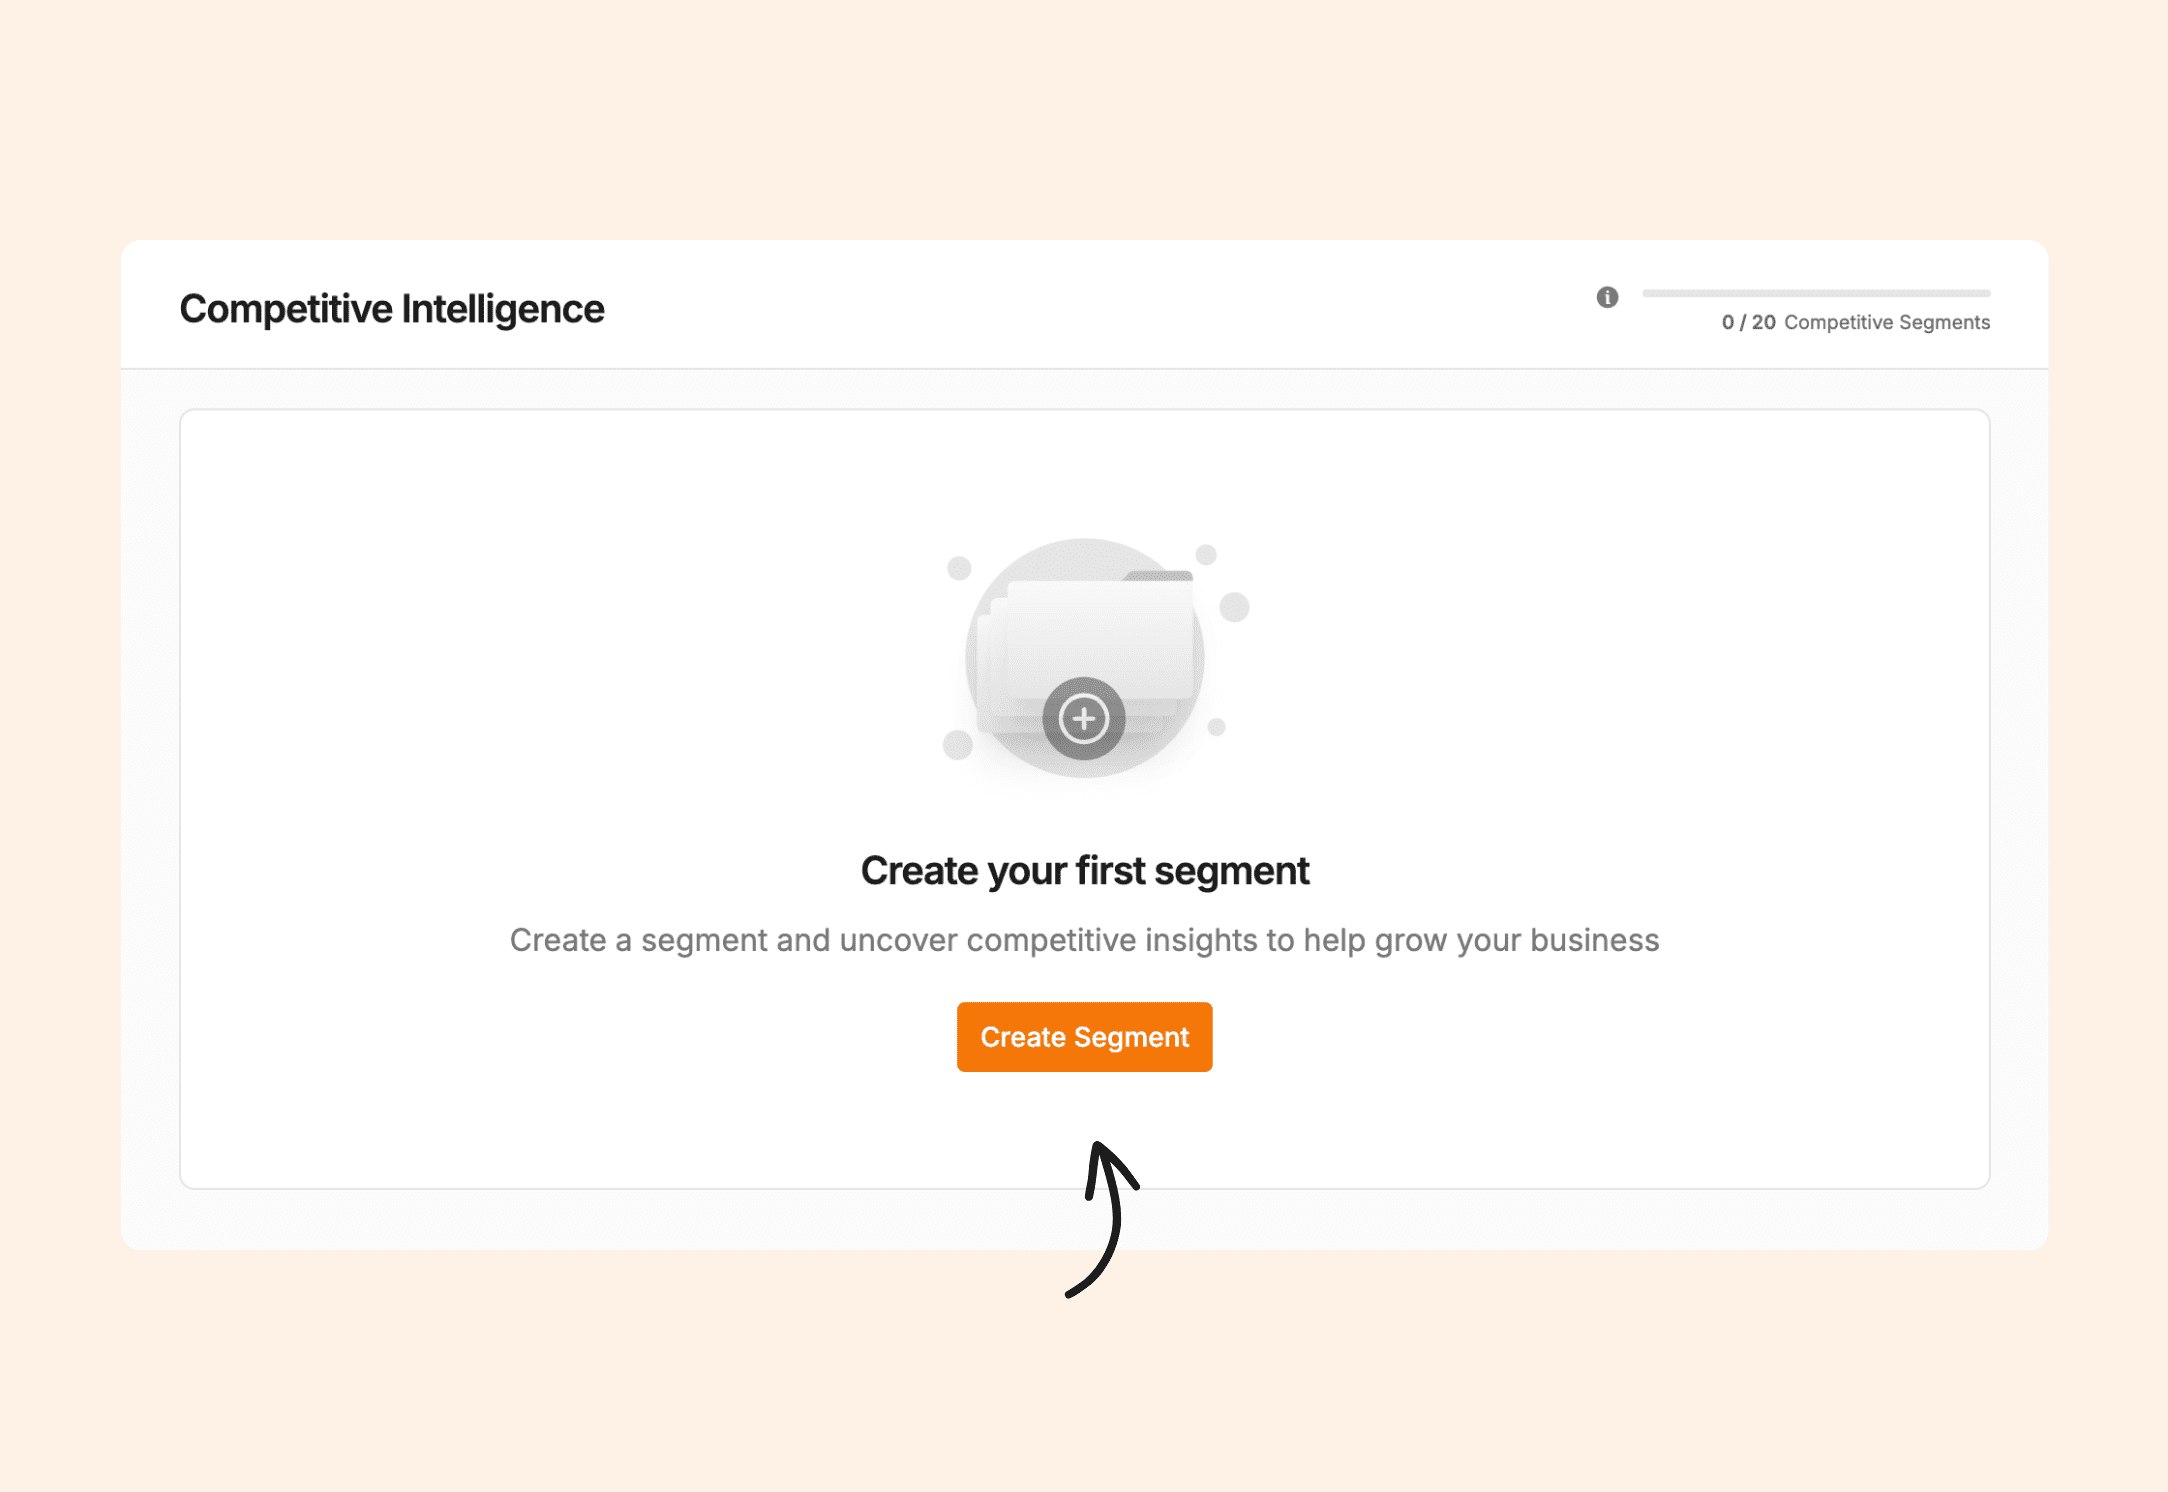
Users can create up to 20 competitive segments at one time. To start, click on “Create Segment.”
If your Jungle Scout account is connected to your Amazon Seller Central account, you can choose one of your products from the Competitive Intelligence tool. You can also enter a product manually by searching for an ASIN.
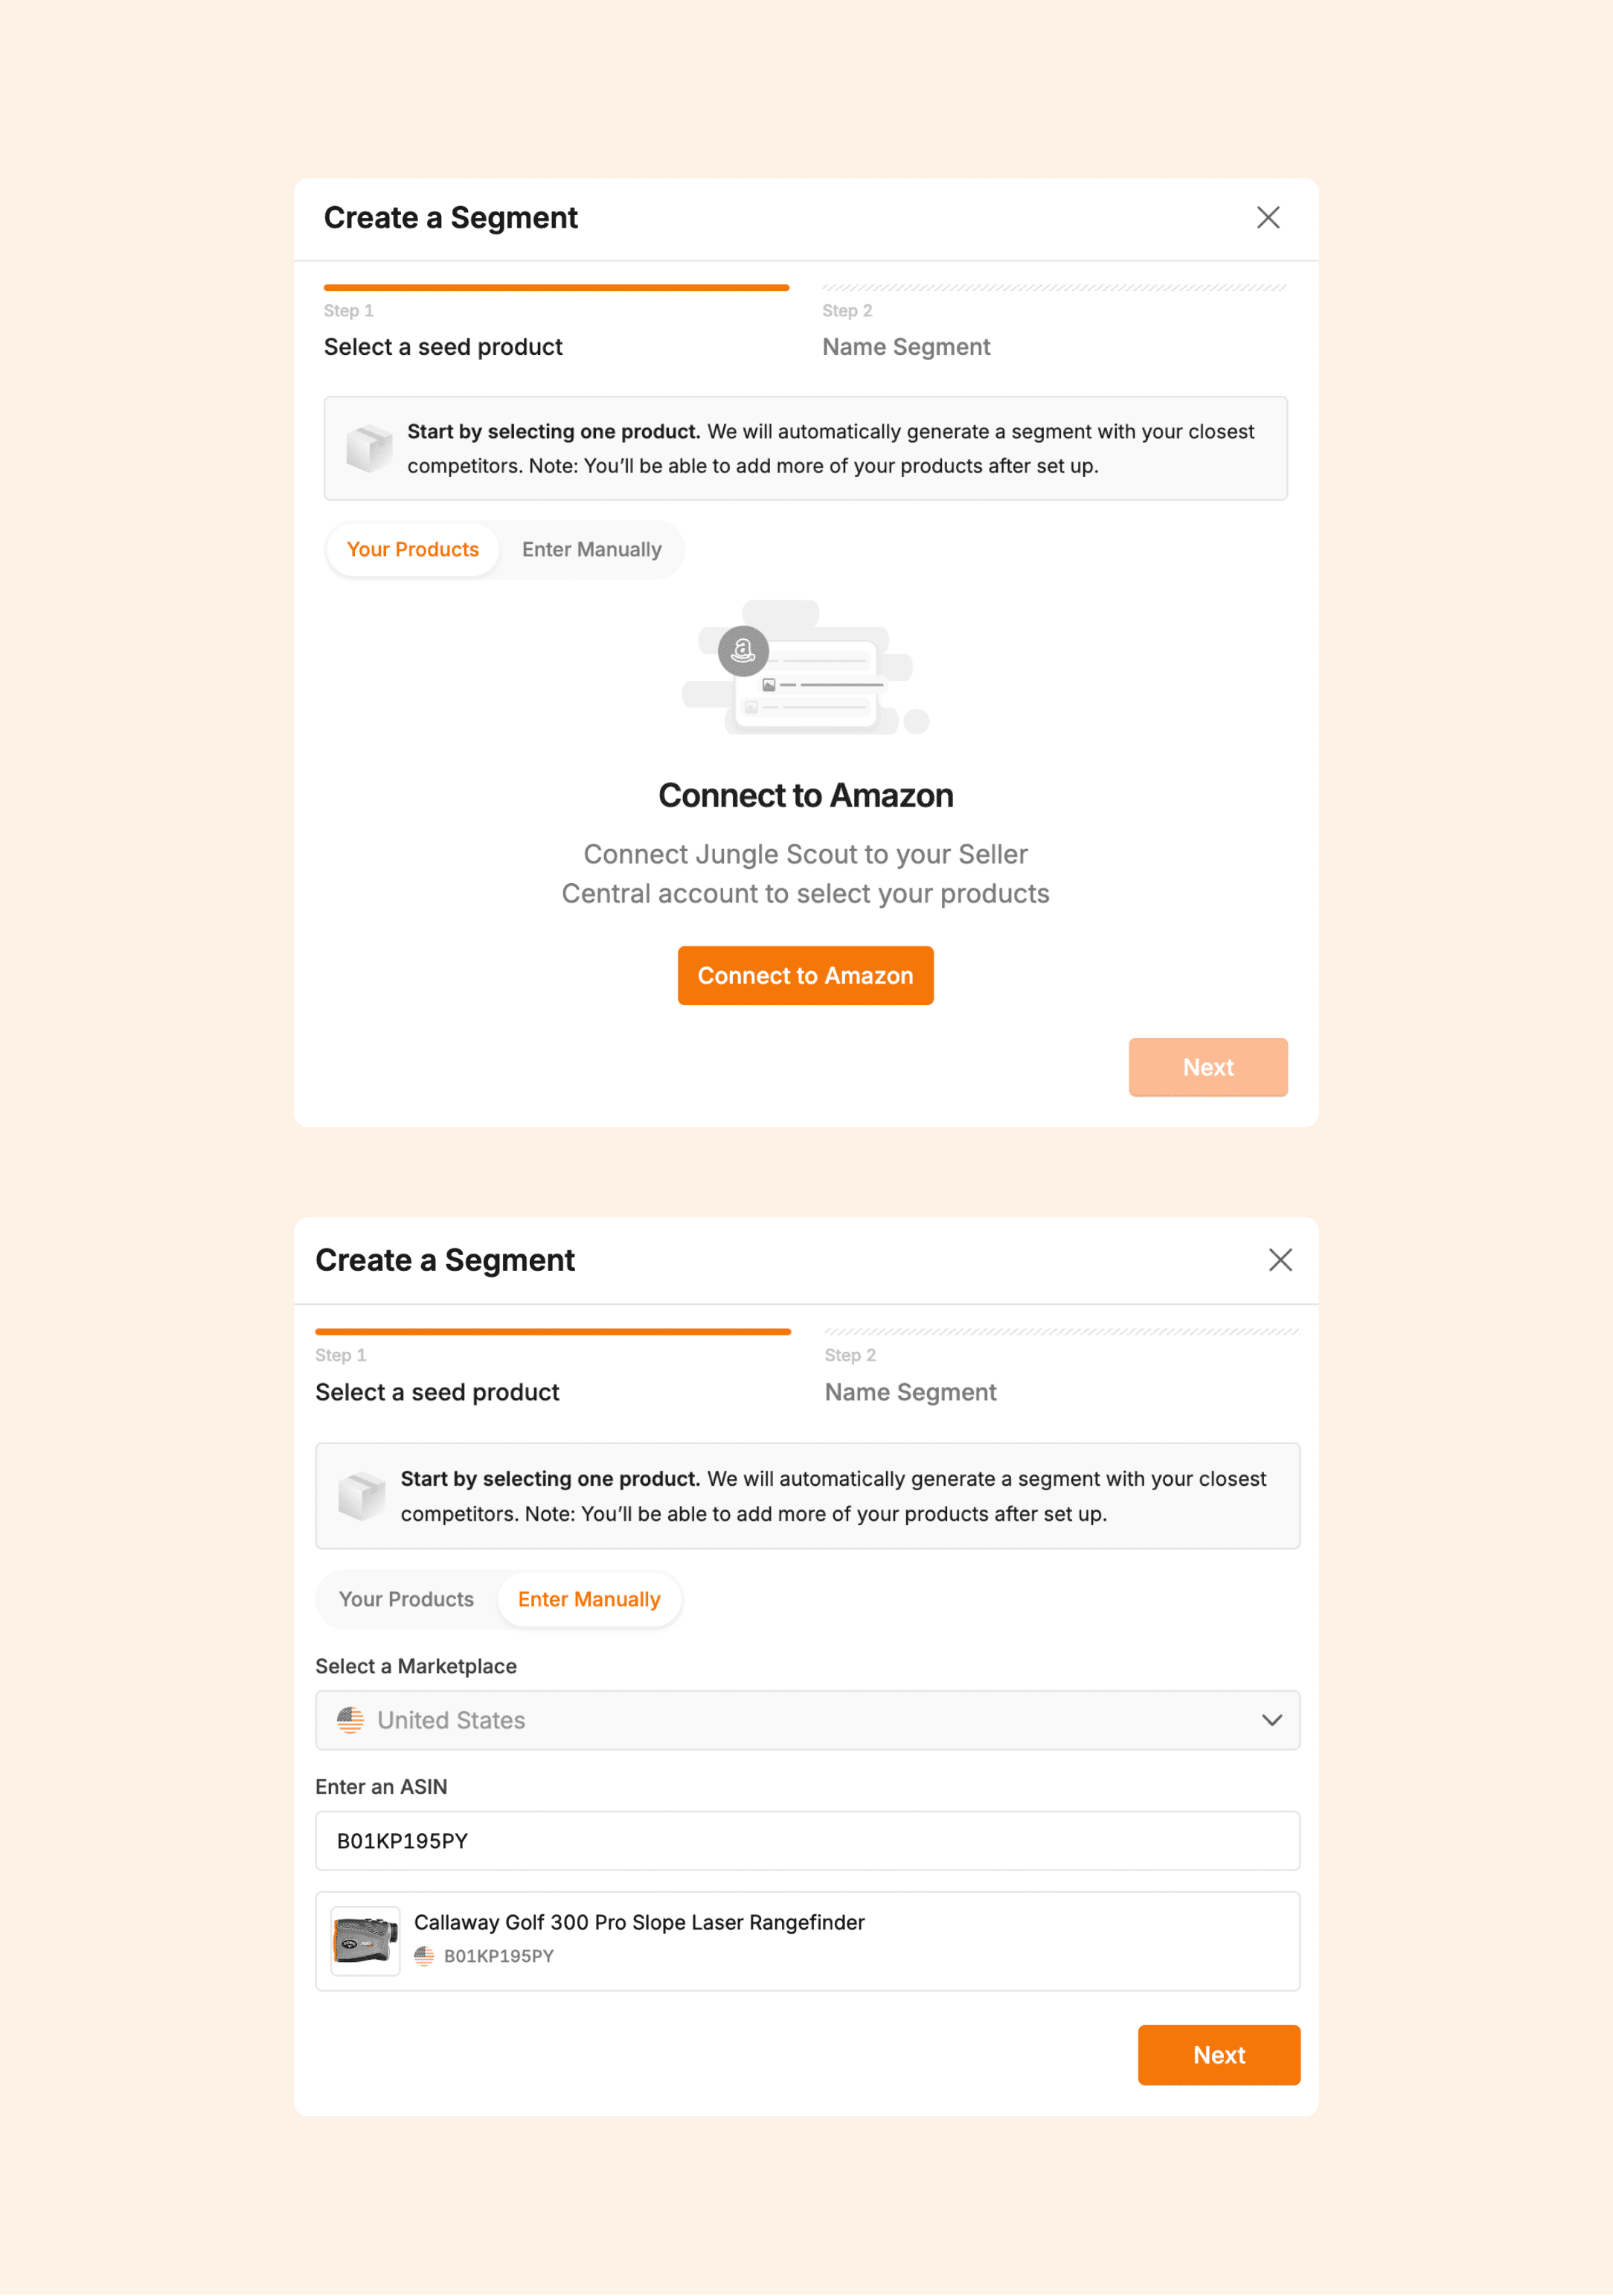
After choosing the product for which you want to generate a market segment, name the segment and click “Finish.” The segment will then begin to process and populate with the competitors that relate most to your product or the product you entered.
High-level market overviews
Based on the ASIN you entered or the product you choose from your catalog, Competitive Intelligence will show how that product compares to the top competitors in that market and your overall market share.
In this example, I entered the ASIN for a Callaway Rangefinder, which owns over 32% of the rangefinder market. If I were interested in selling this type of product, these types of competitive insights would help me make decisions on whether or not to sell this product.
The tool will also show you the market’s total revenue and total units sold (for the time period chosen—it defaults to 12 months).
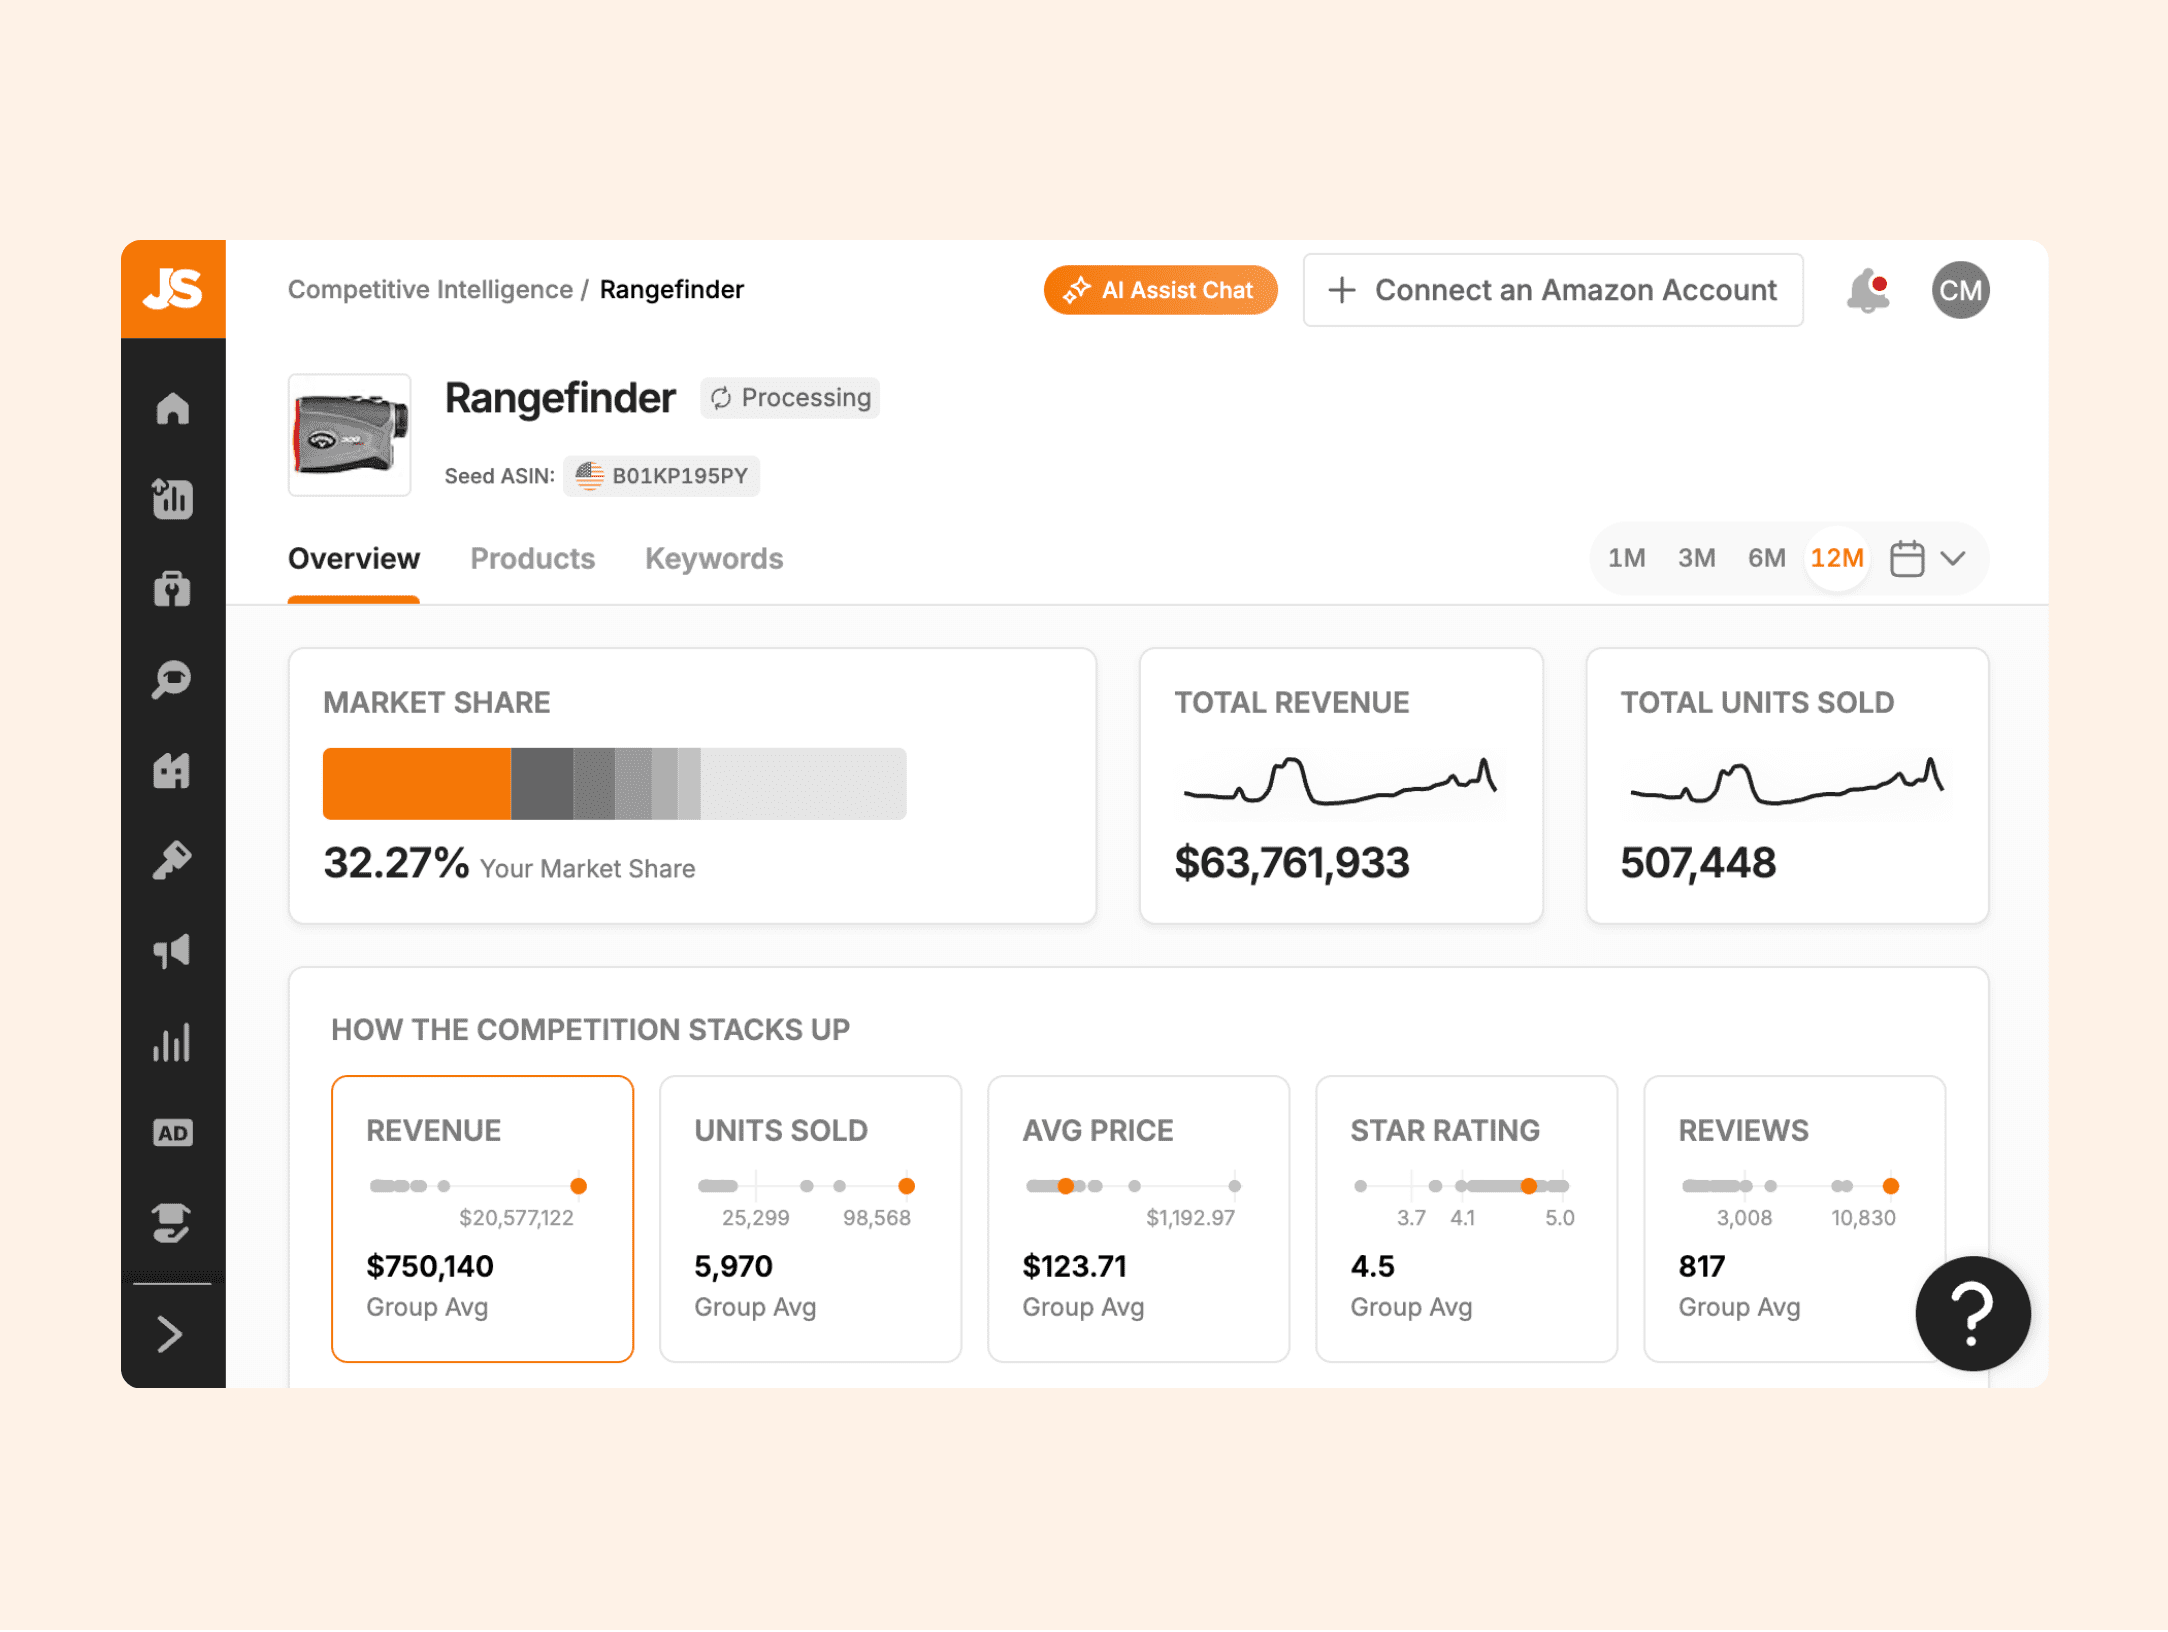
I can see that five major brands own 65% of the entire rangefinder market, with Callaway owning 33%. Based on this information, I may decide against this product as there are some major players in this market, and the remaining 35% of the market share is owned by hundreds of other brands selling rangefinders.
Finding competitors
Say I already sold a rangefinder; I can use this information to determine who my top competitors are, how many units they sell per week or month, what their average price points are, and how fast they’re gaining reviews.
Then, I can evaluate the top 5-10 brands and see if they’re doing anything different than my brand in terms of listing optimization, imagery, marketing, advertising, and so on.
Let’s look at a different golf product.
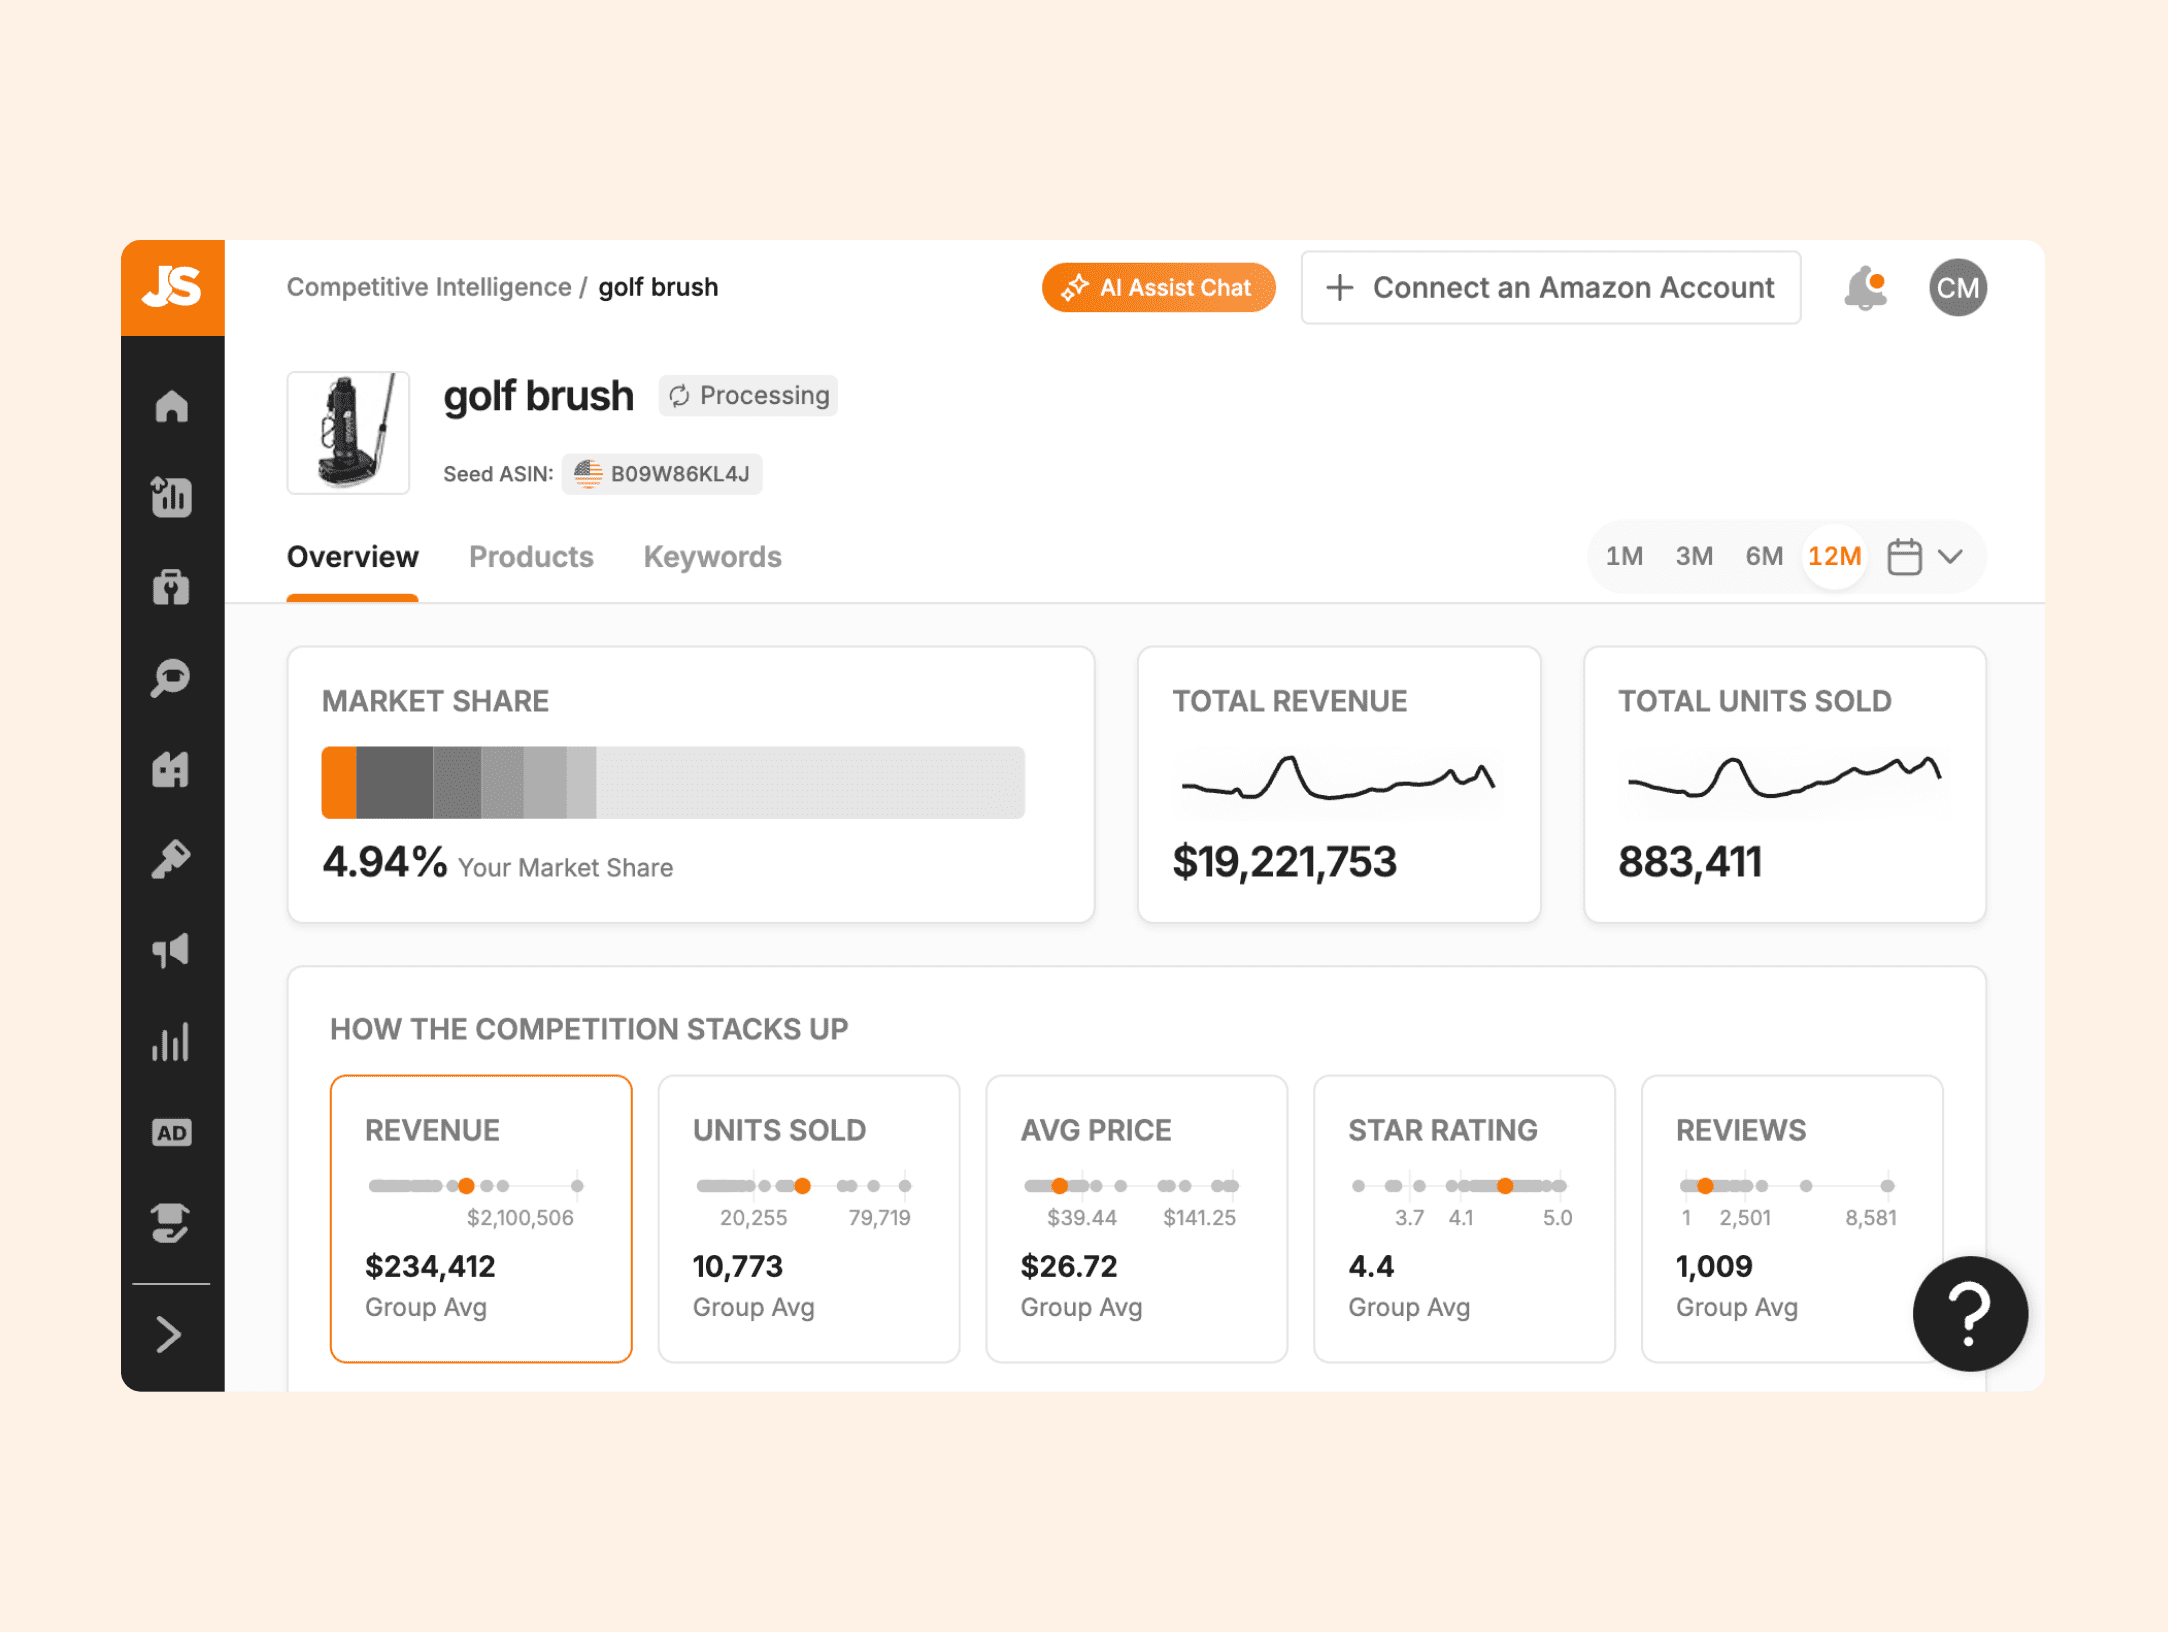
Now, we’re looking into the golf club brush market. In this example, say our brand is the orange on the market share graph, signifying that we own 8.14% of the market, which is fairly in line with the other top brands.
With competitive intelligence, I can get a closer look at the other top 5 brands to see their pricing strategy and which keywords they’re targeting to see if we’ve missed any in our listings or PPC campaigns.
Visual competitive mapping
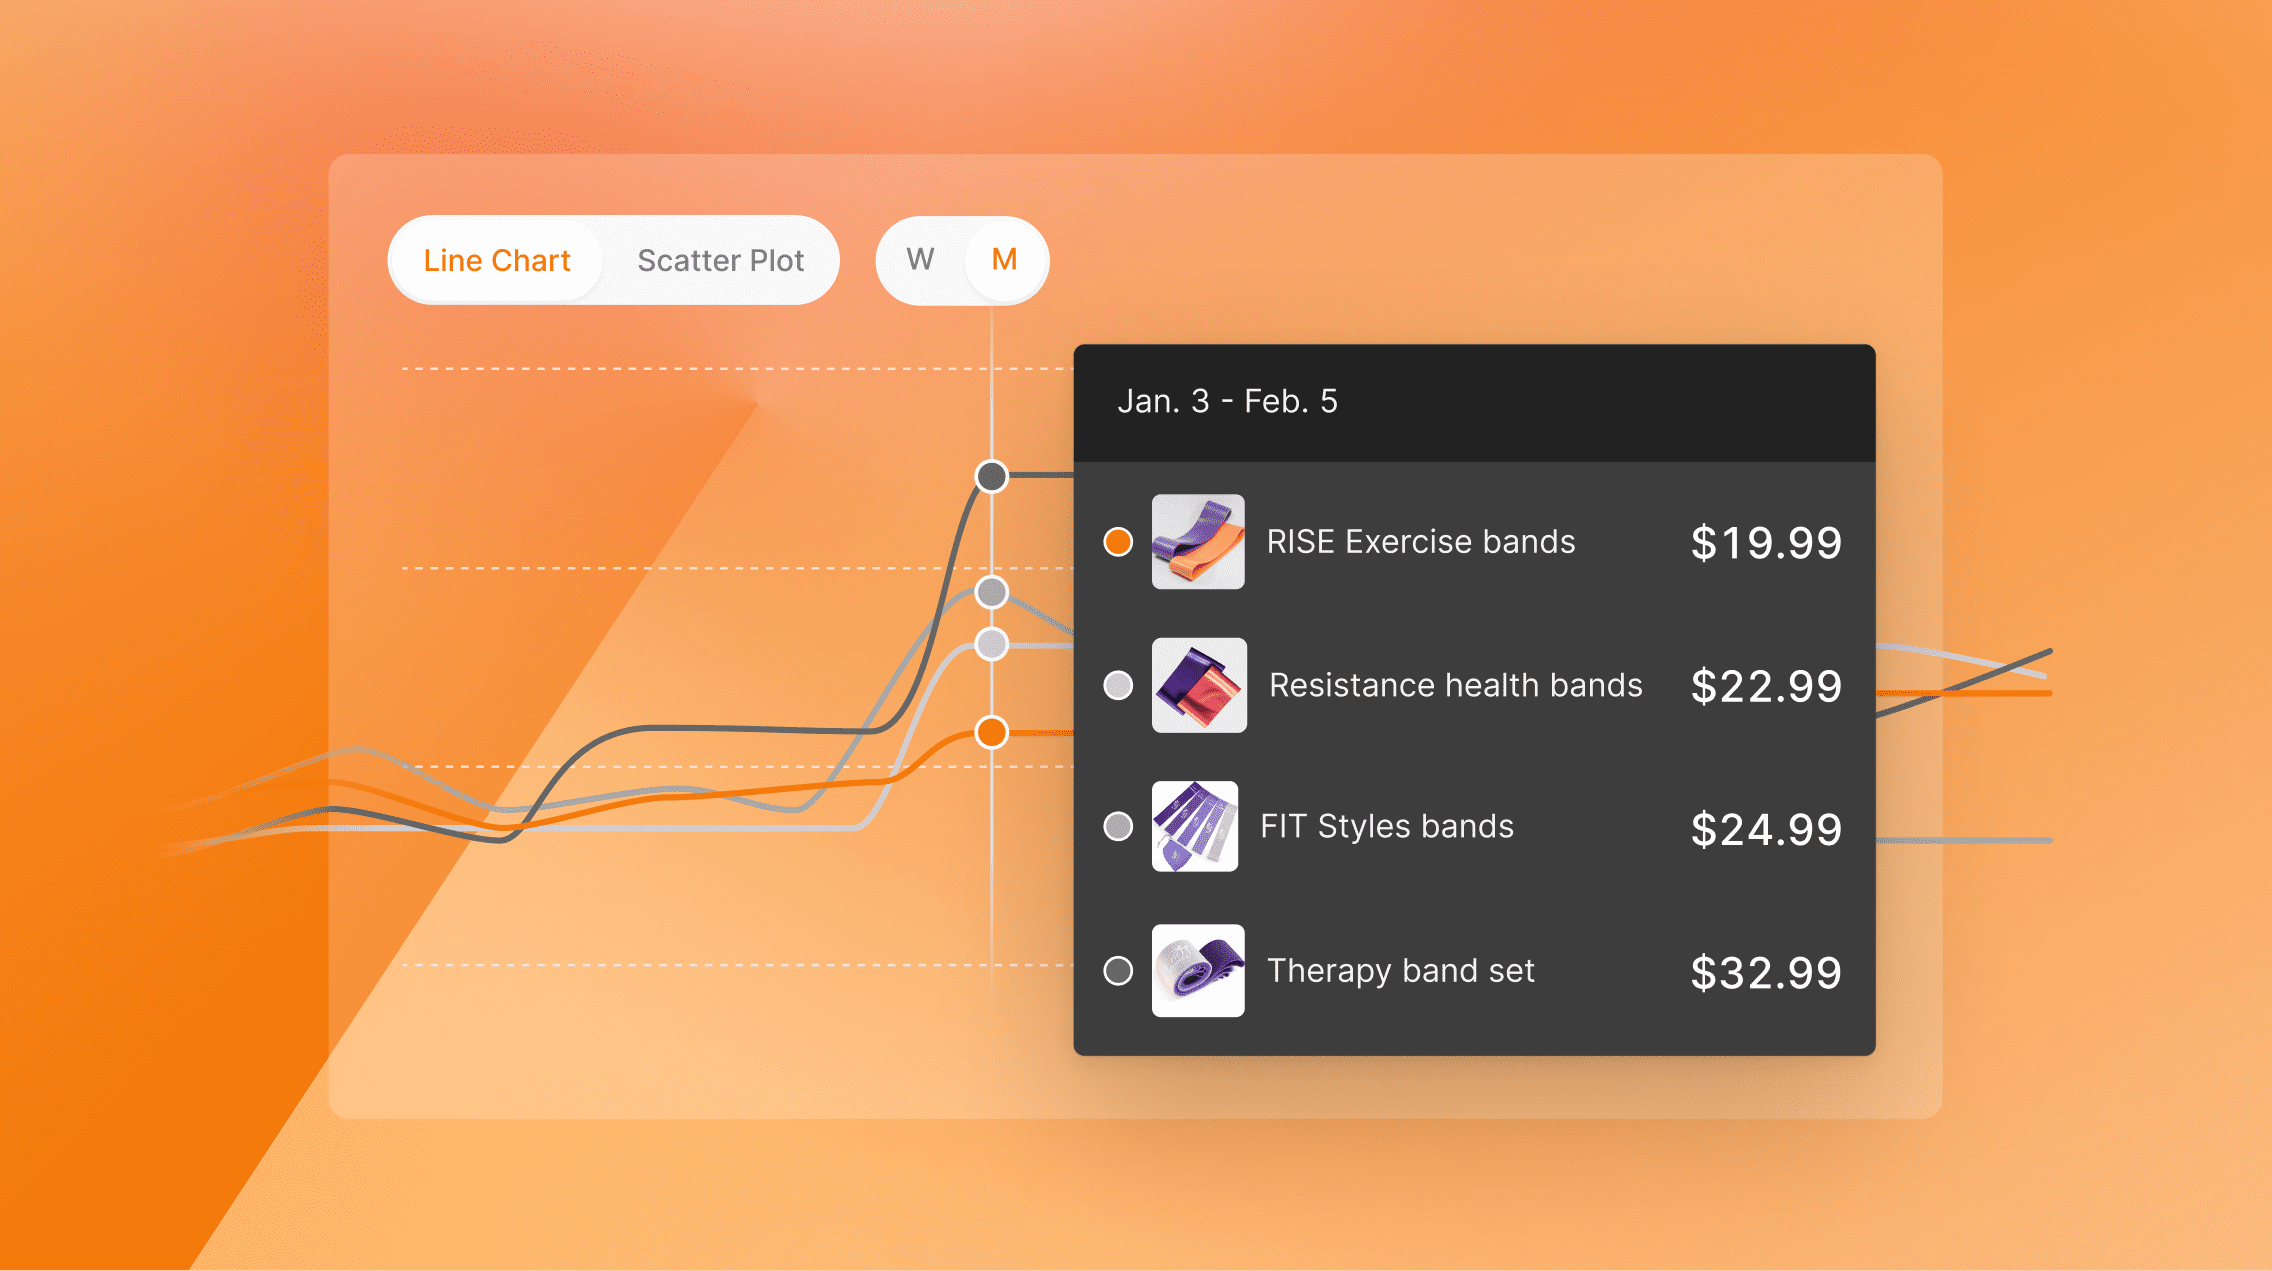
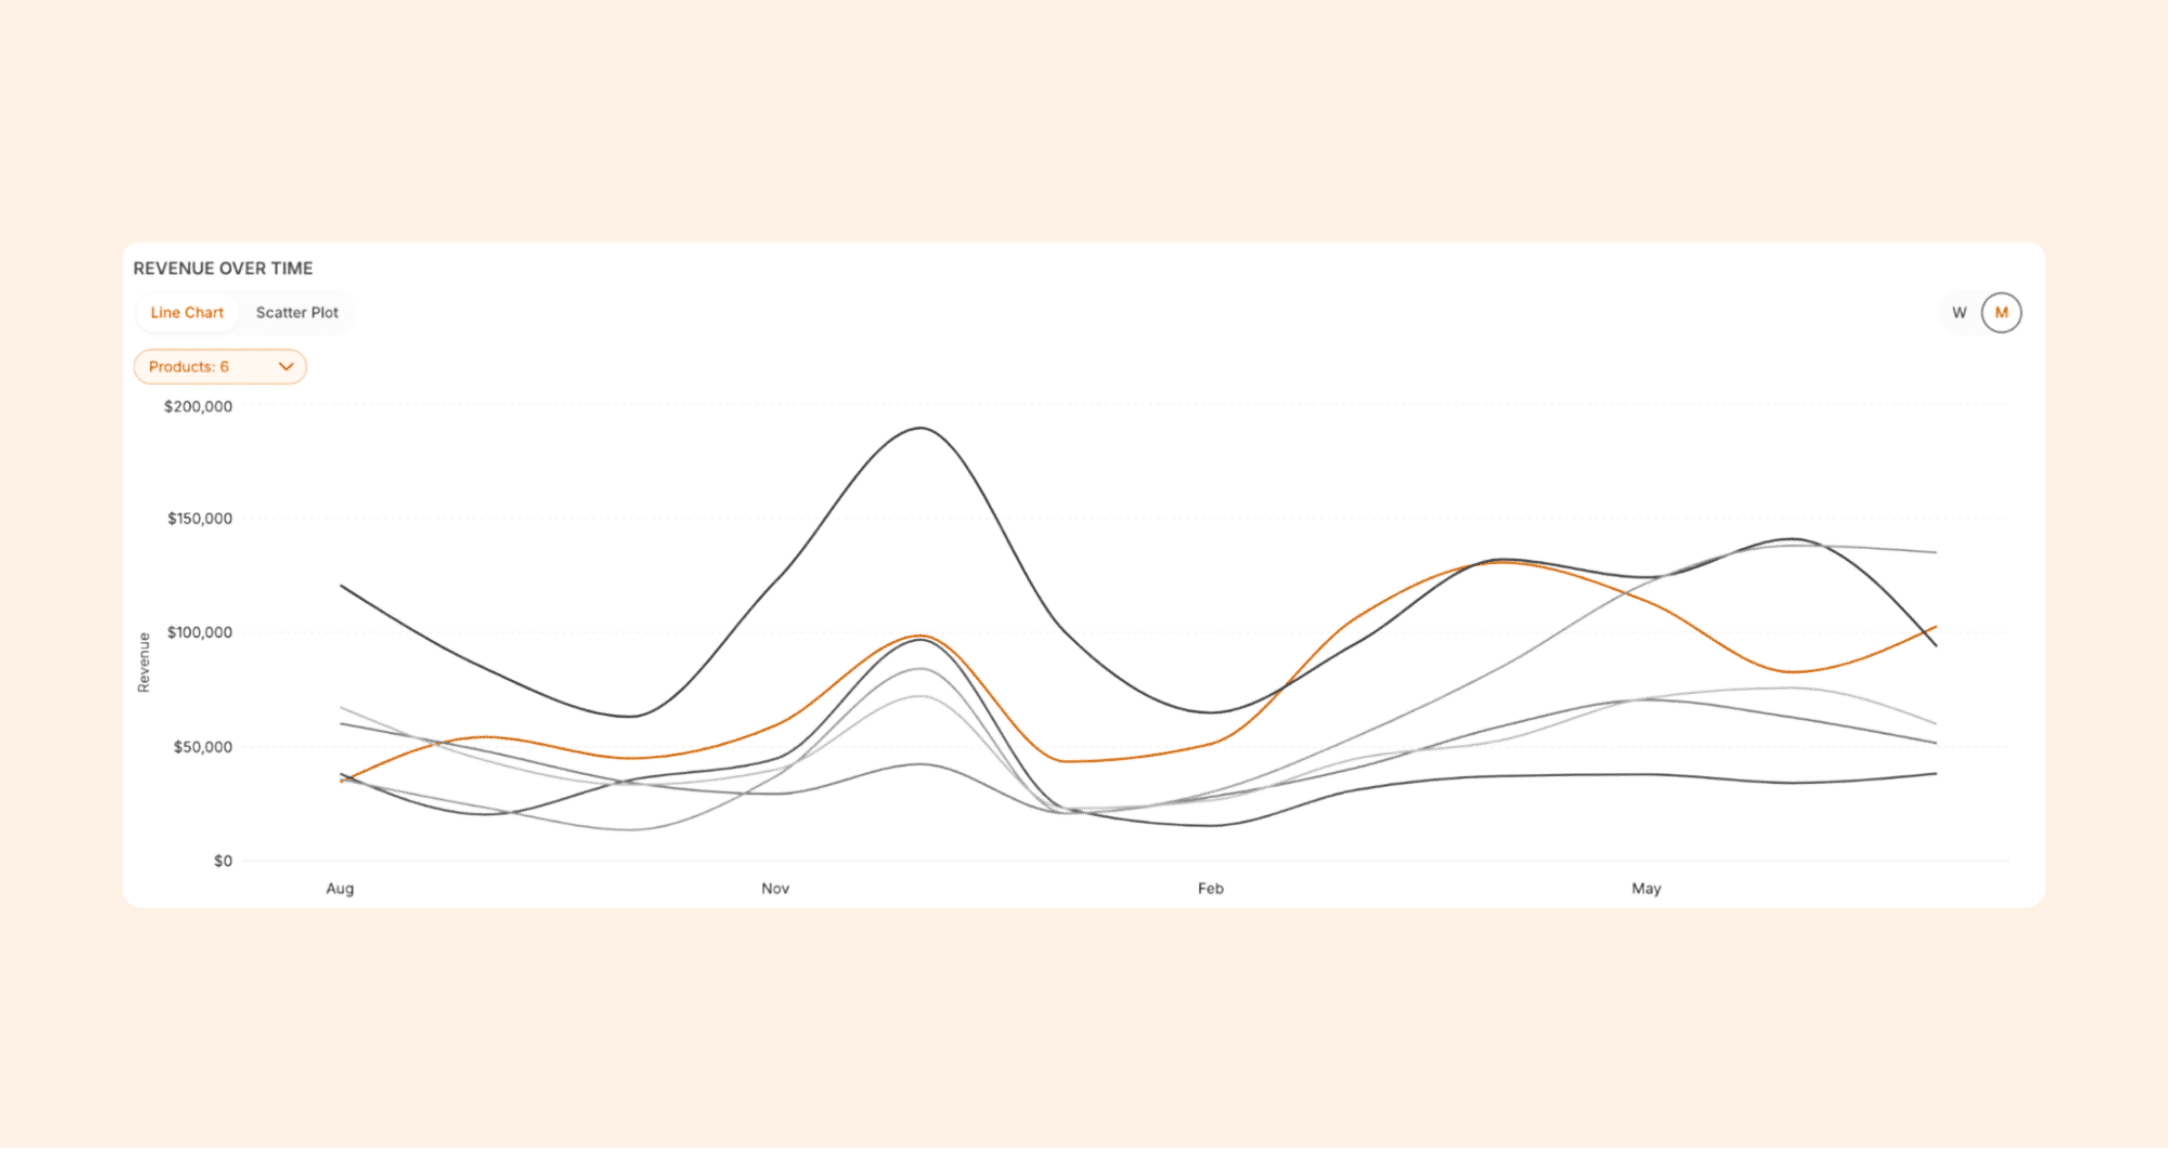
Below, you will find a chart where you can choose up to six products to view simultaneously. The chart will default to revenue over time, but you can view it by units sold, average price, star rating, and reviews.
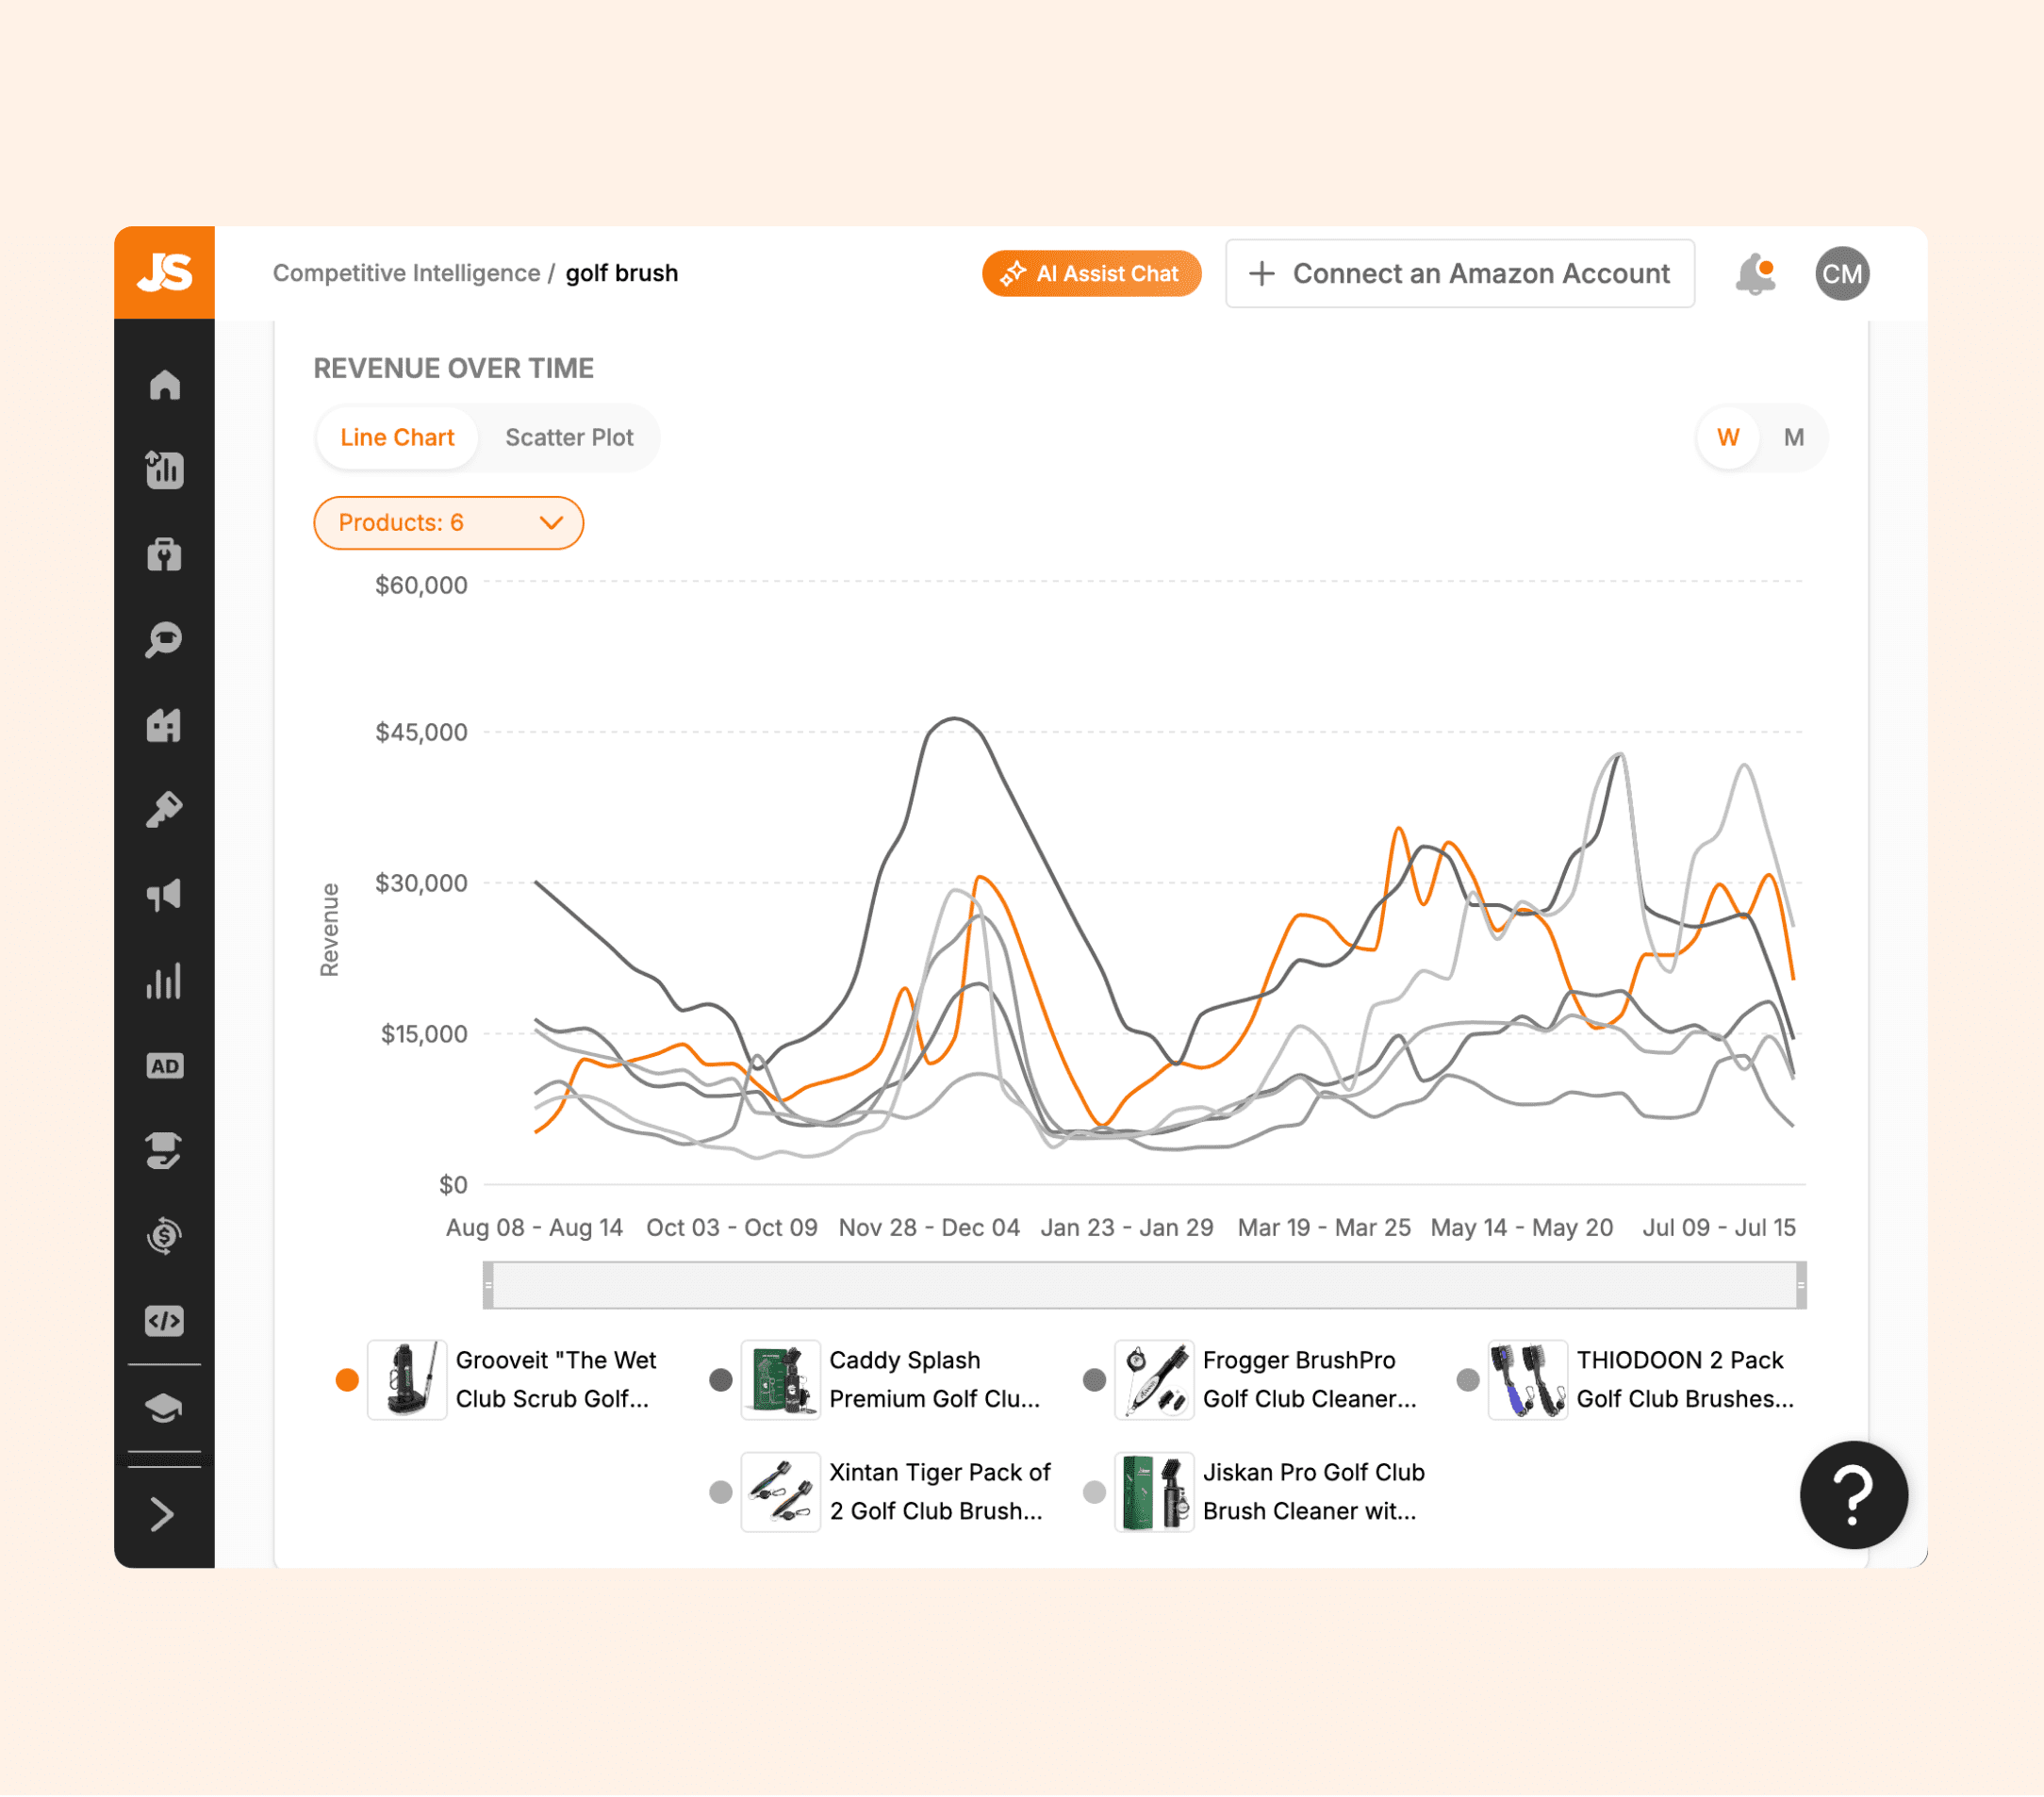
Looking at the line graph, we can see that our brand (the orange line) has been gaining market share as our revenue increased in 2024. This is interesting because that product is higher priced and rated lower overall than other brands.
If we want to increase market share even more, we can test lower pricing that is more comparable to our closest competitors to see if that helps increase our sales volume—as long as it’s profitable, of course.
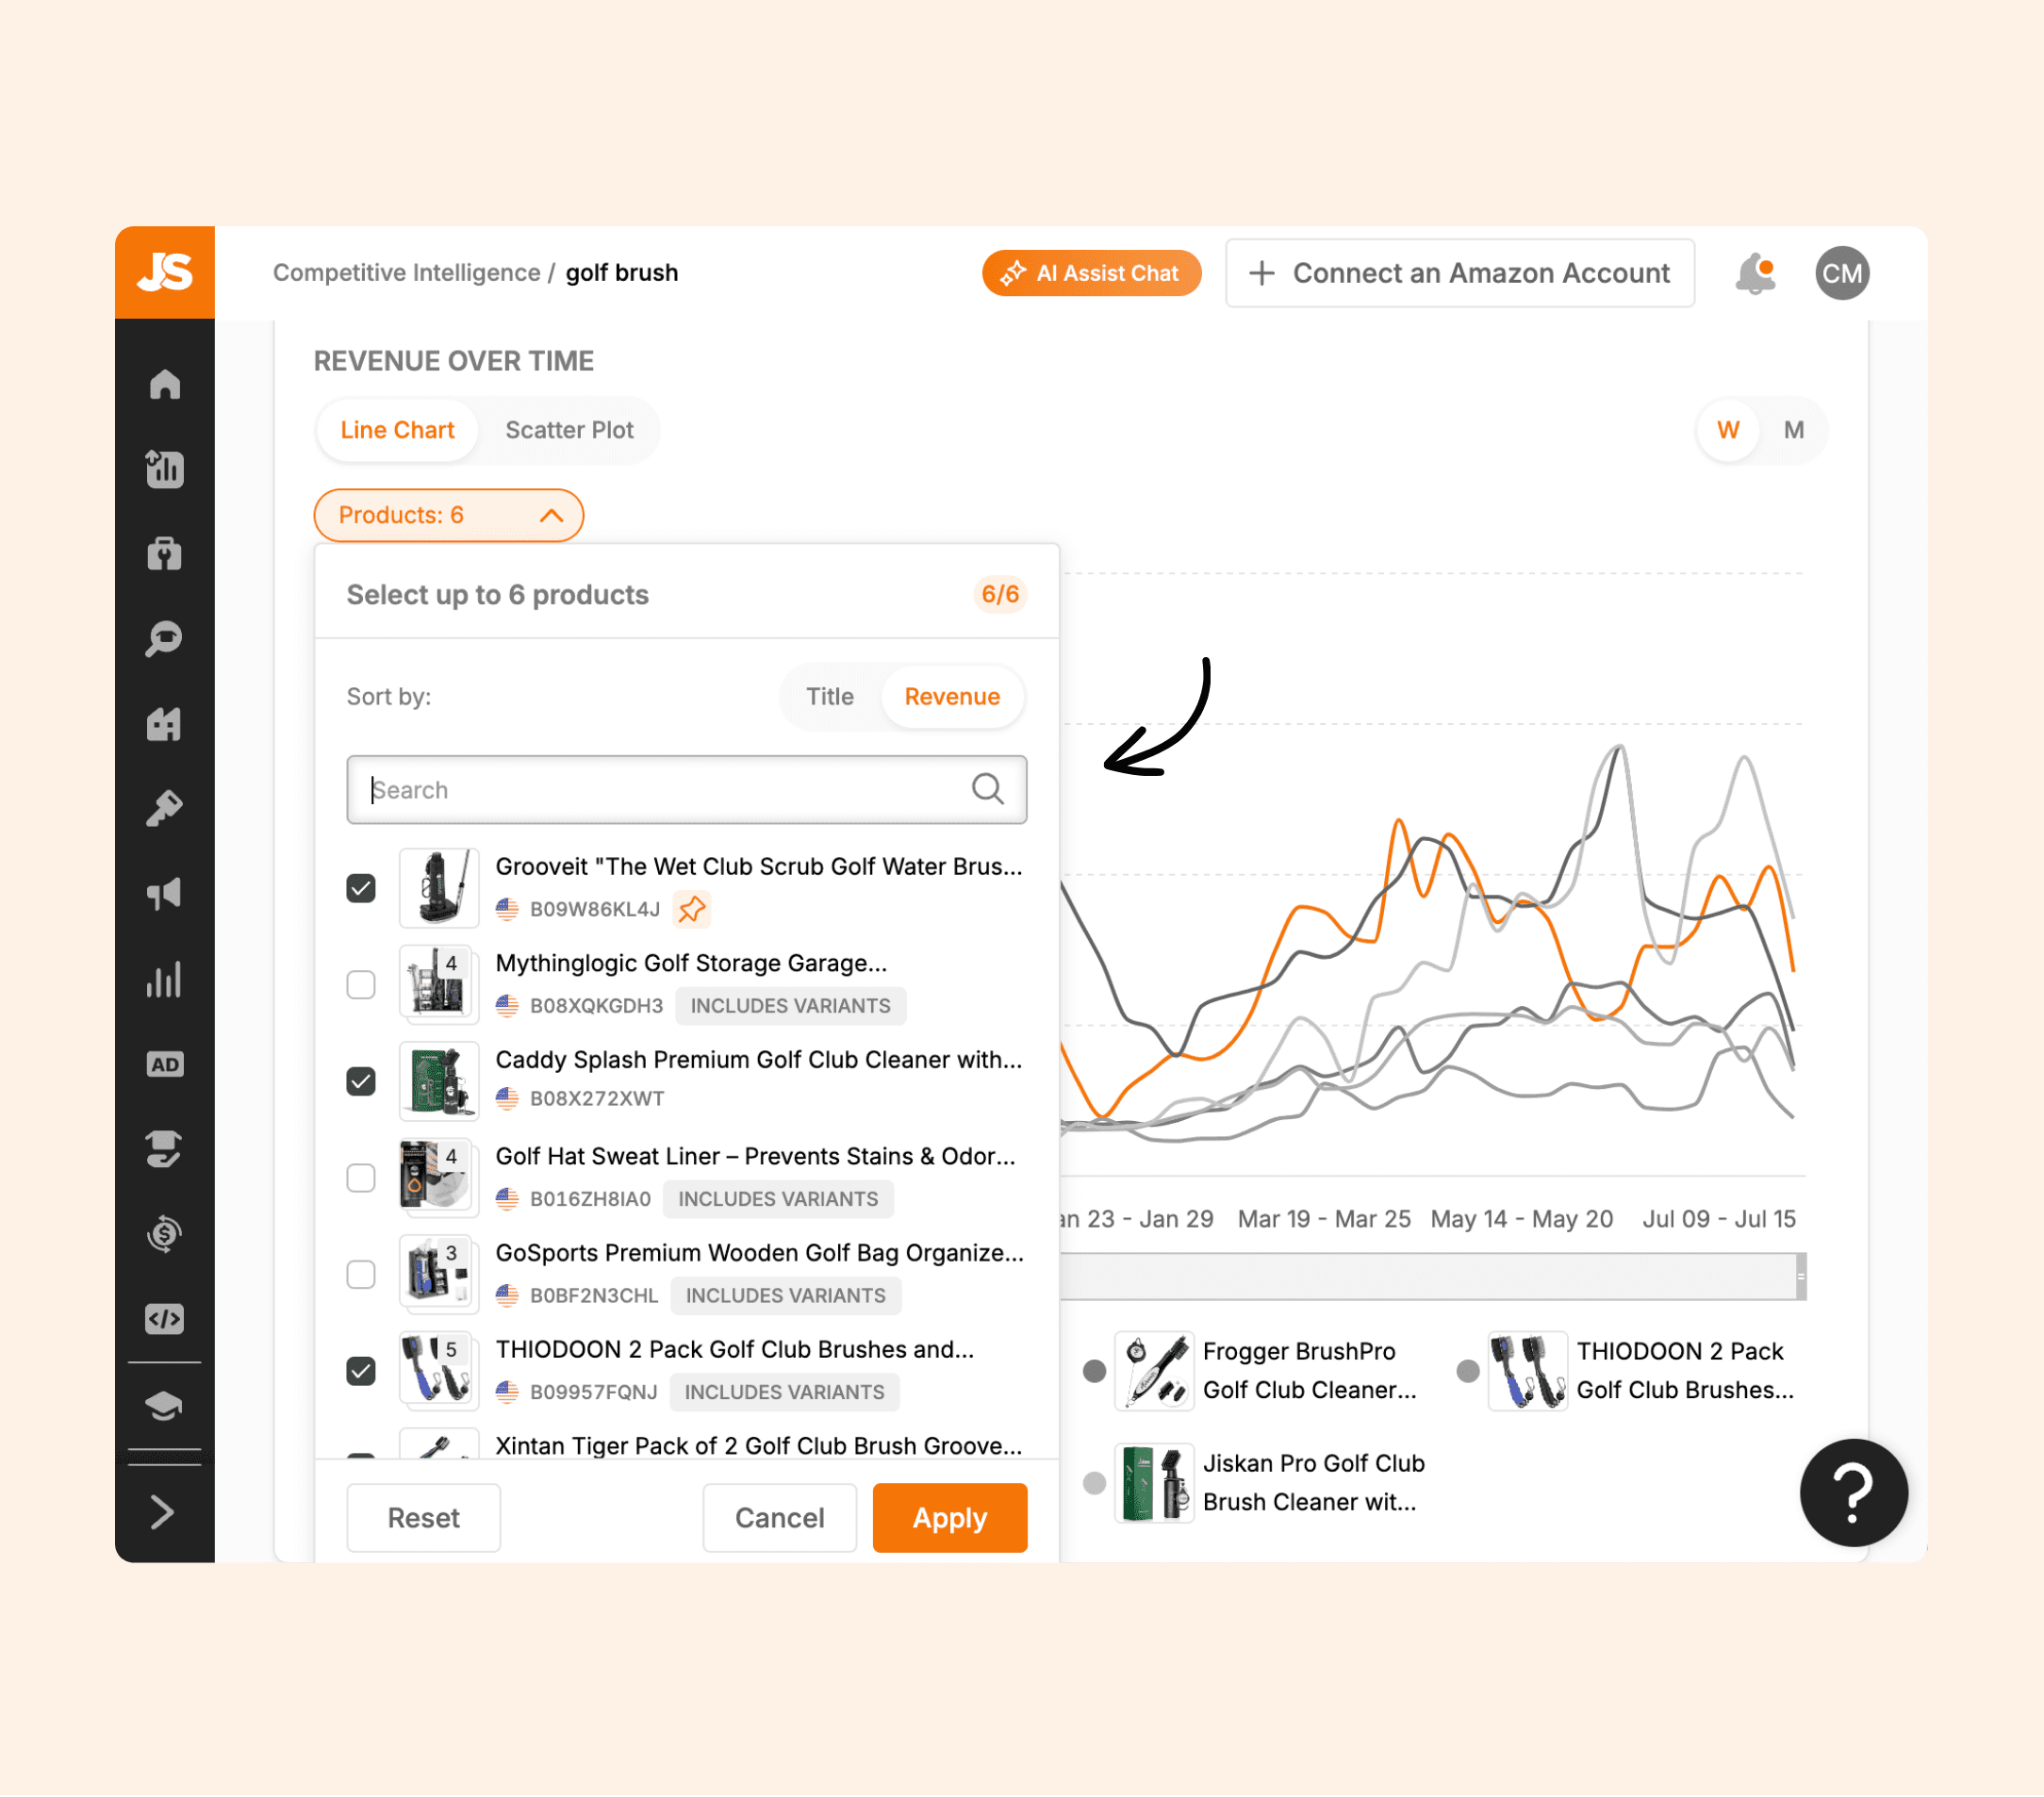
You can also change the products shown on the chart by clicking on the ‘Products’ dropdown. This allows you to compare yours to other products within the market that may be a closer competitor to your brand.
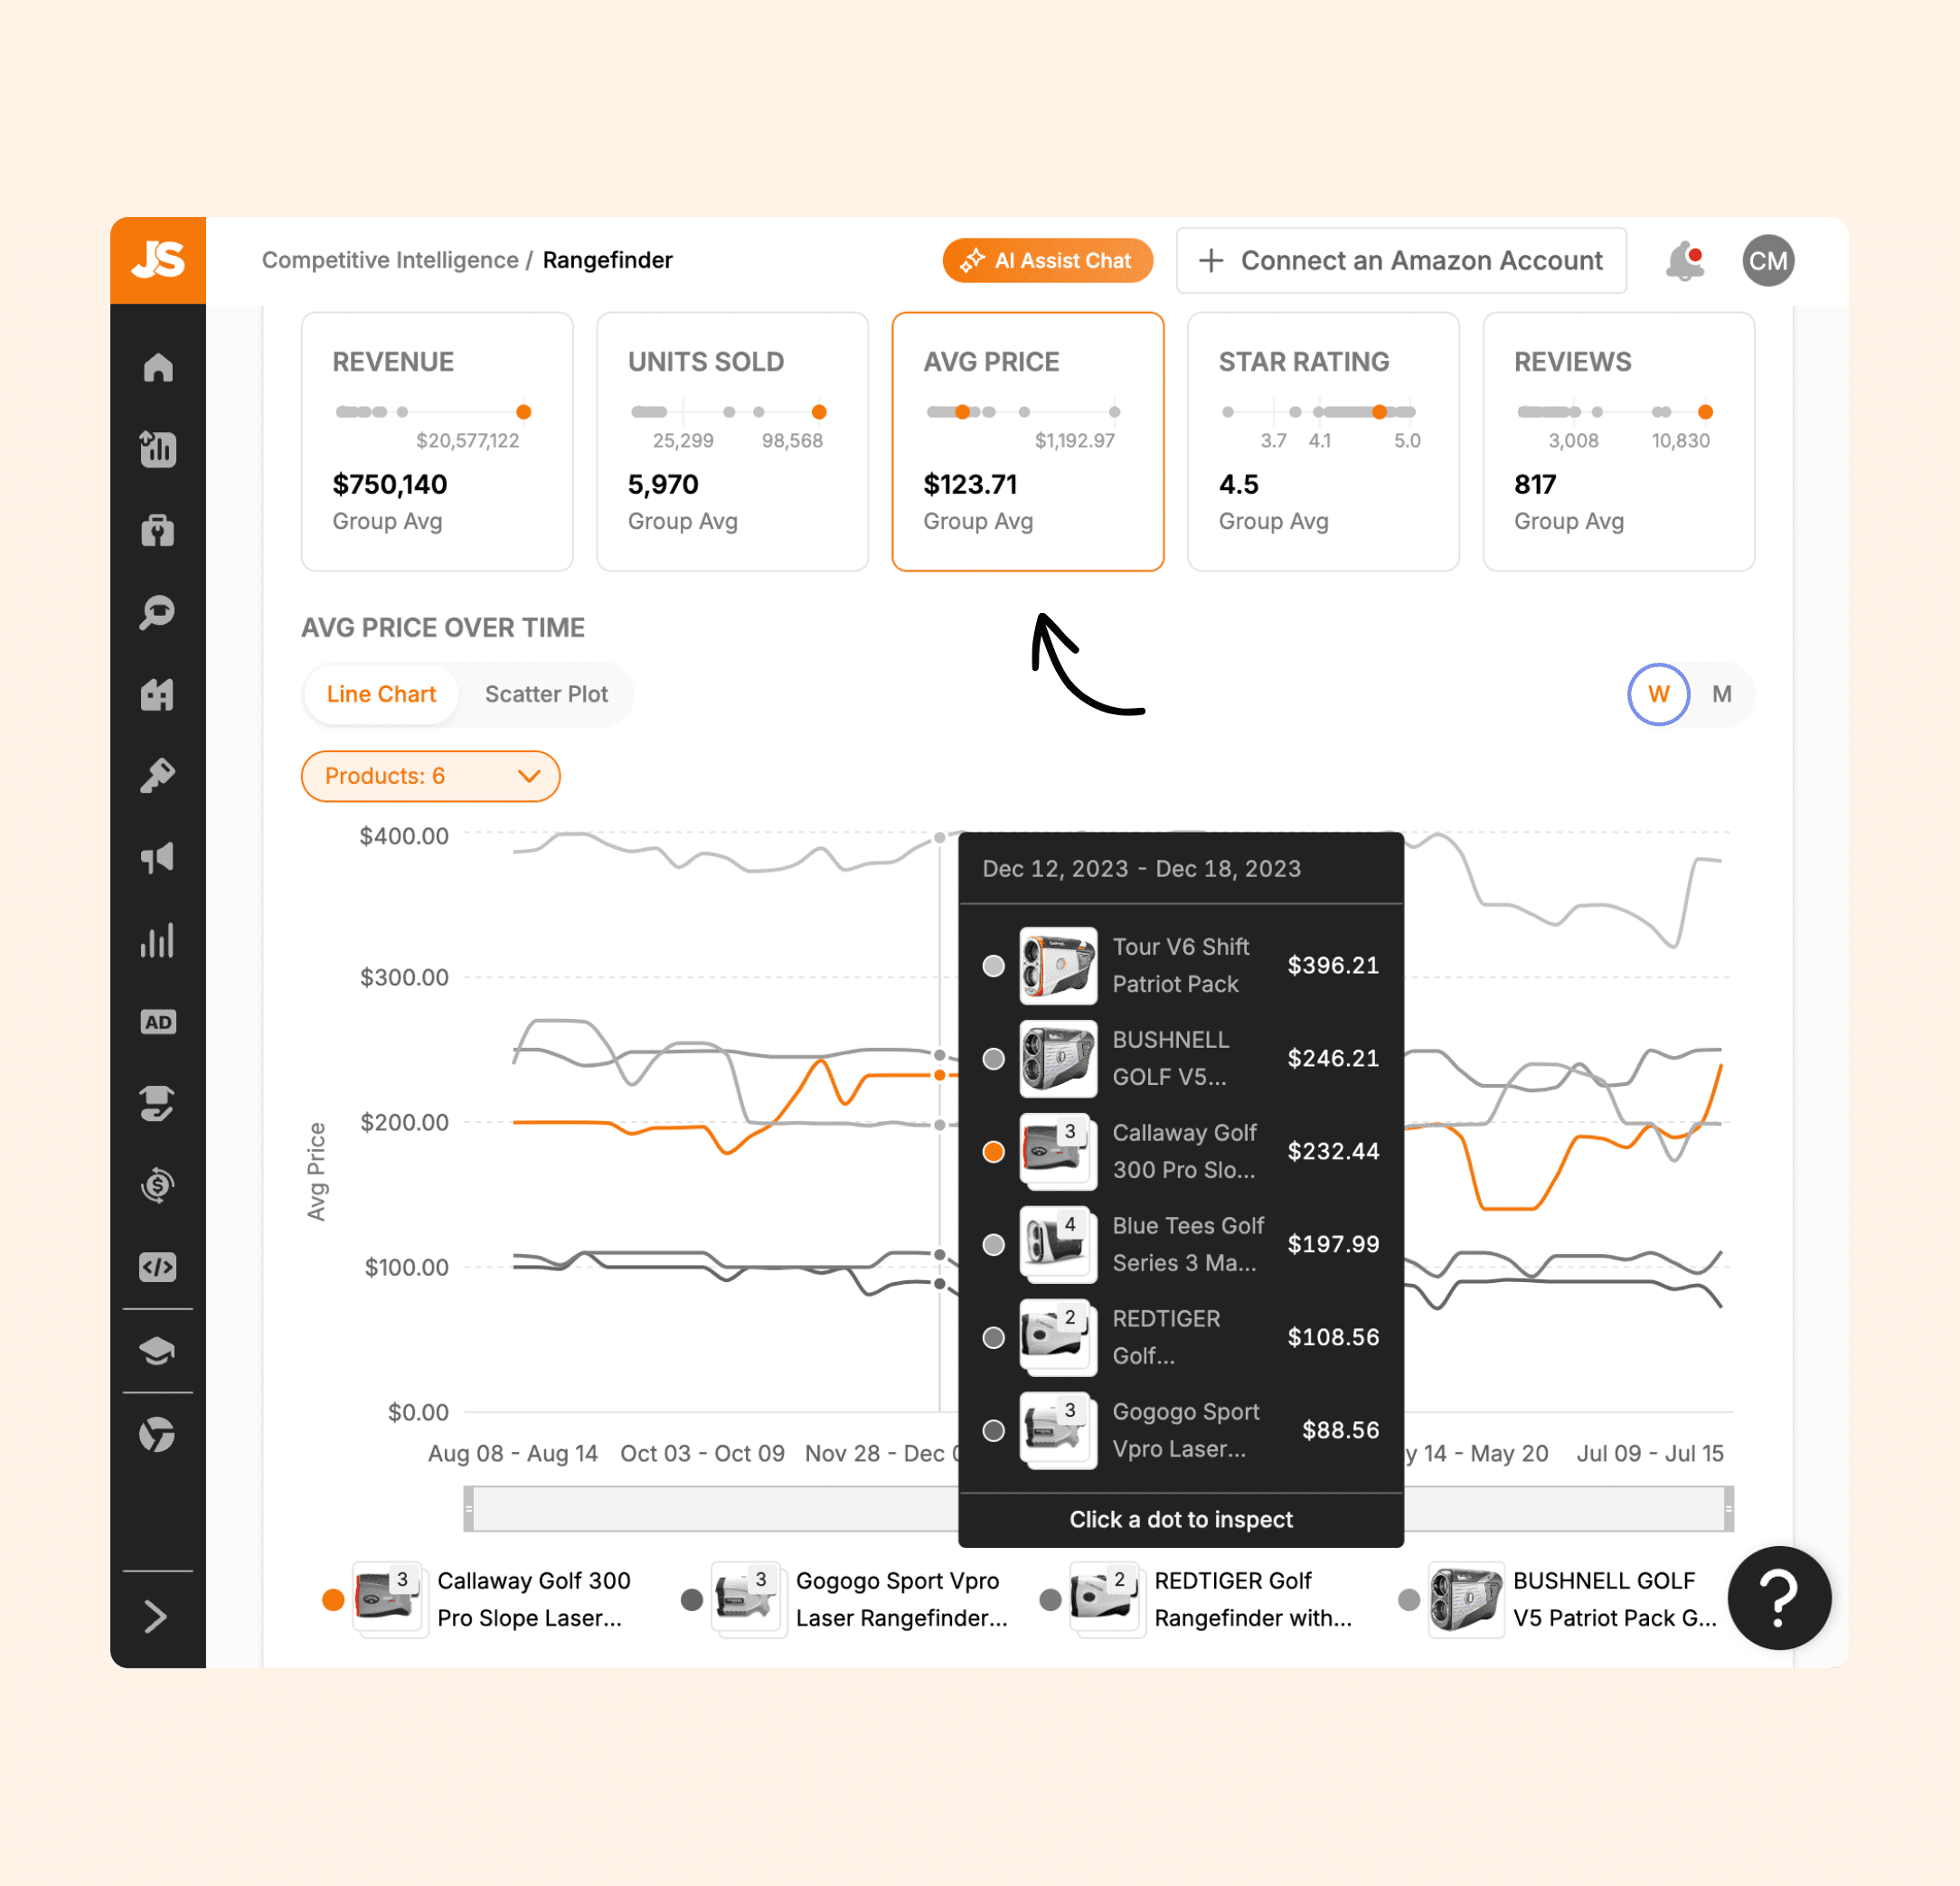
Analyze competitor pricing
Pricing is one of the biggest factors when it comes to a customer deciding which product to purchase. Understanding where your competitors are pricing their products is how you can decide which pricing strategy works best for your brand.
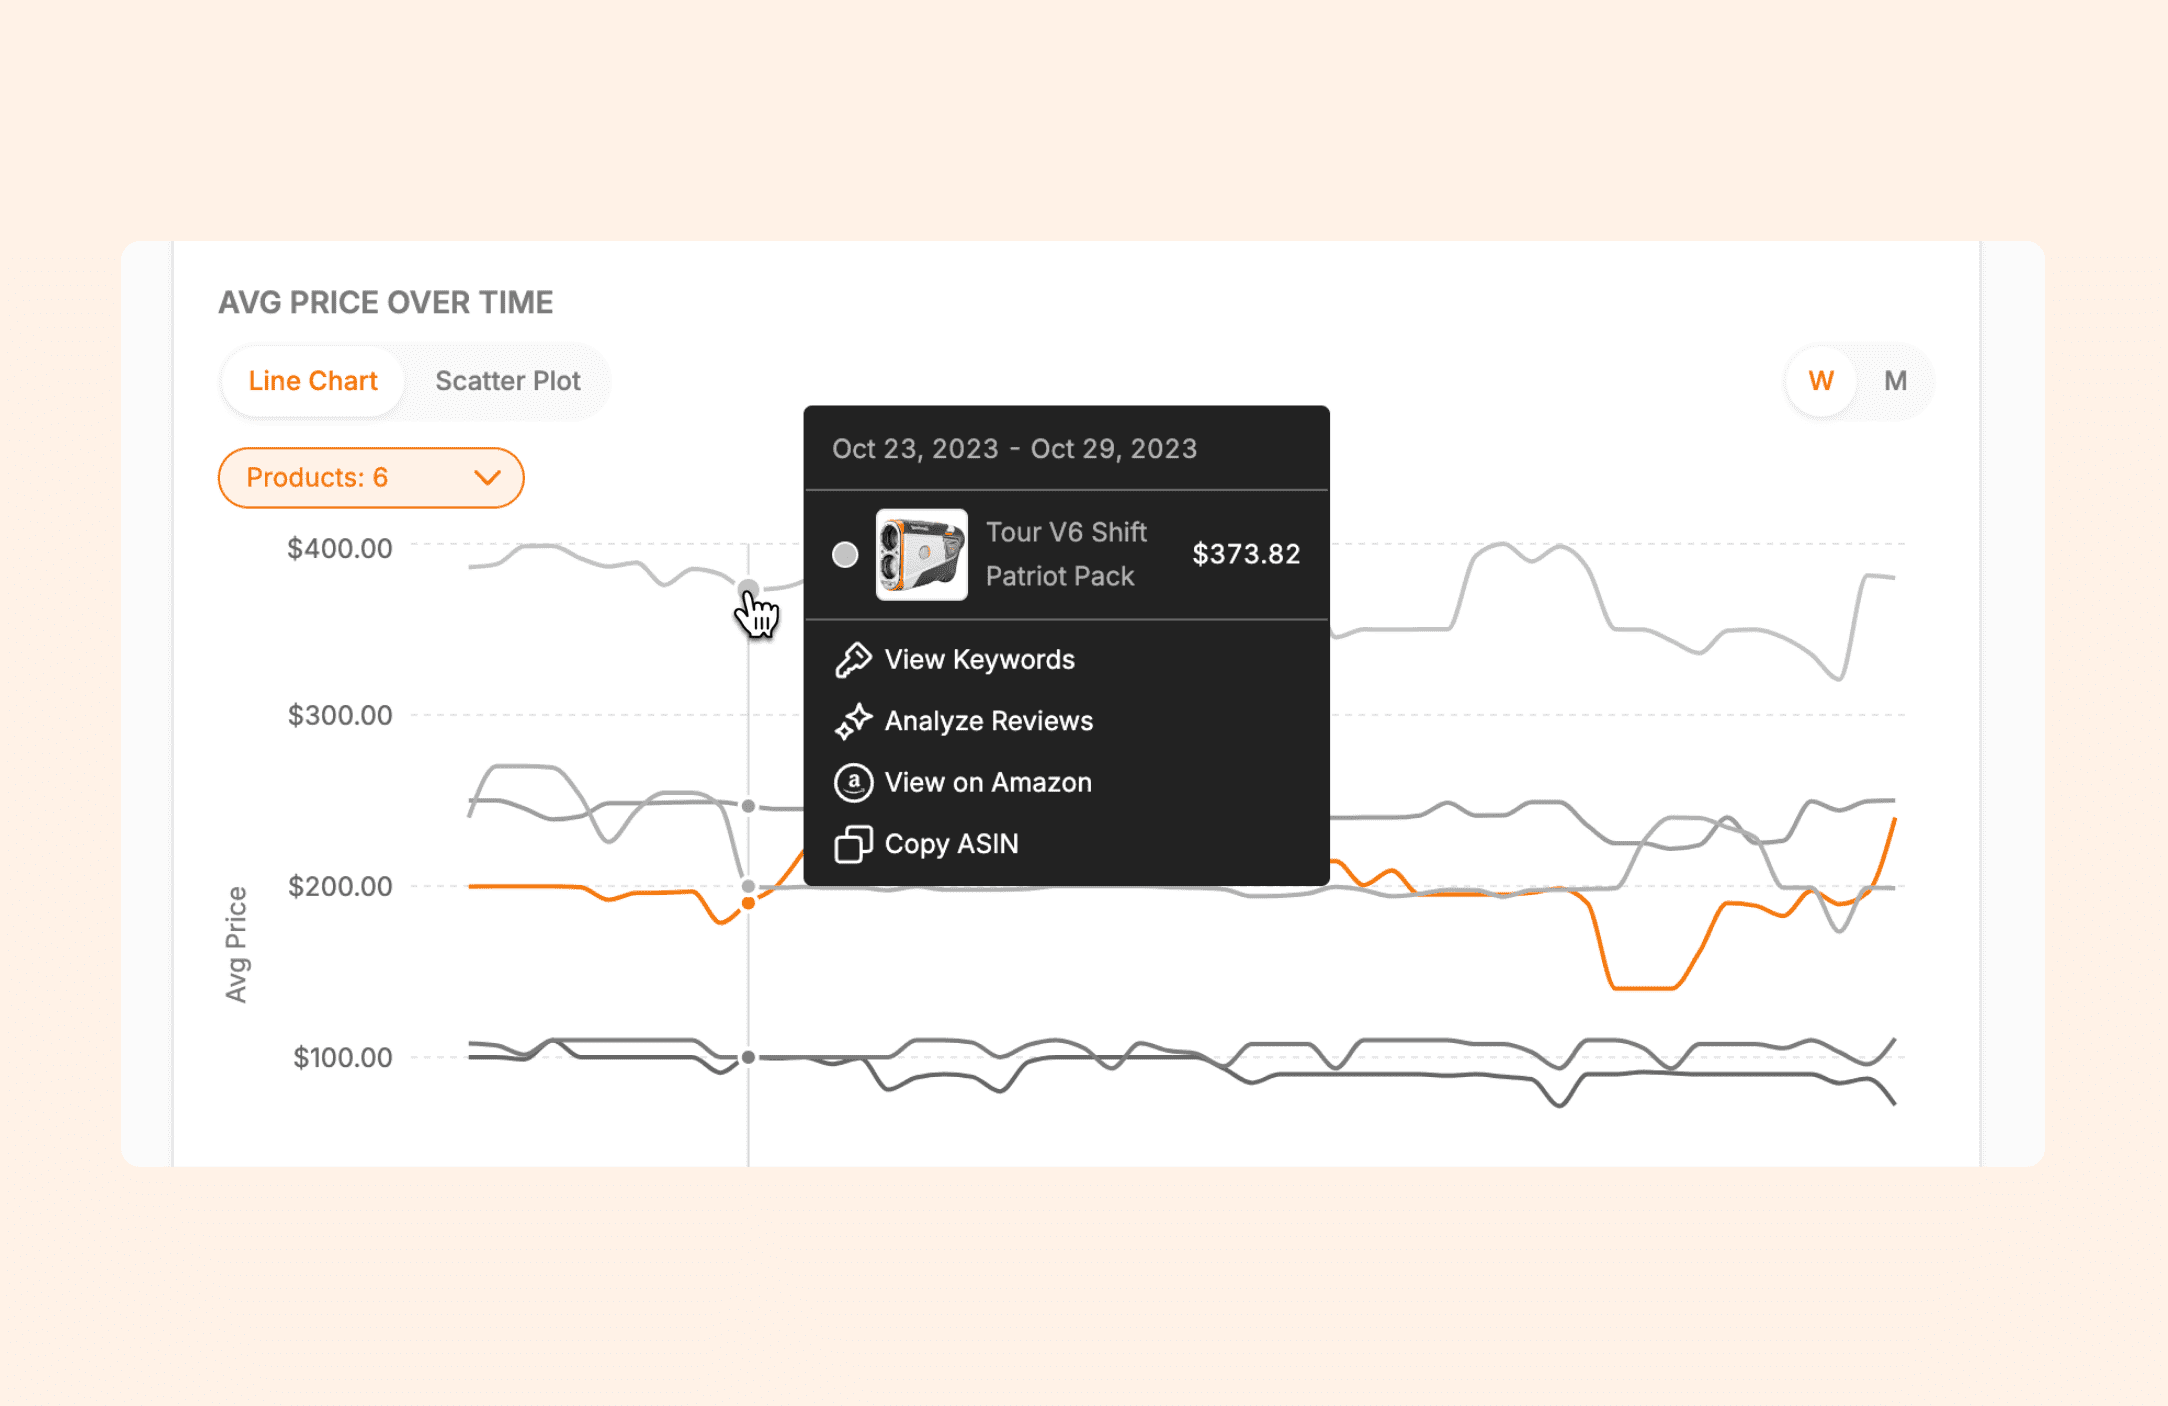
With the line chart, you can view the pricing of your product and competitors’ products over time. Based on the information below, the pricing for each product varies widely. Some rangefinders are very expensive, and other brands are more affordable.
I would then review each product listing and evaluate the features to better understand why a brand is priced the way it is.
You can also analyze the reviews of each product using Jungle Scout AI Review Analysis to identify the most common positive and negative comments. To do so, click on one of the dots on the chart and click ‘Analyze Reviews.’
Under the ‘Products’ tab, you can see the average price for each brand along with some other metrics. Suppose your products have similar metrics (like ratings and review count) and features. In that case, this information can help you stay competitive and maximize profitability by understanding and adjusting to competitor pricing strategies.
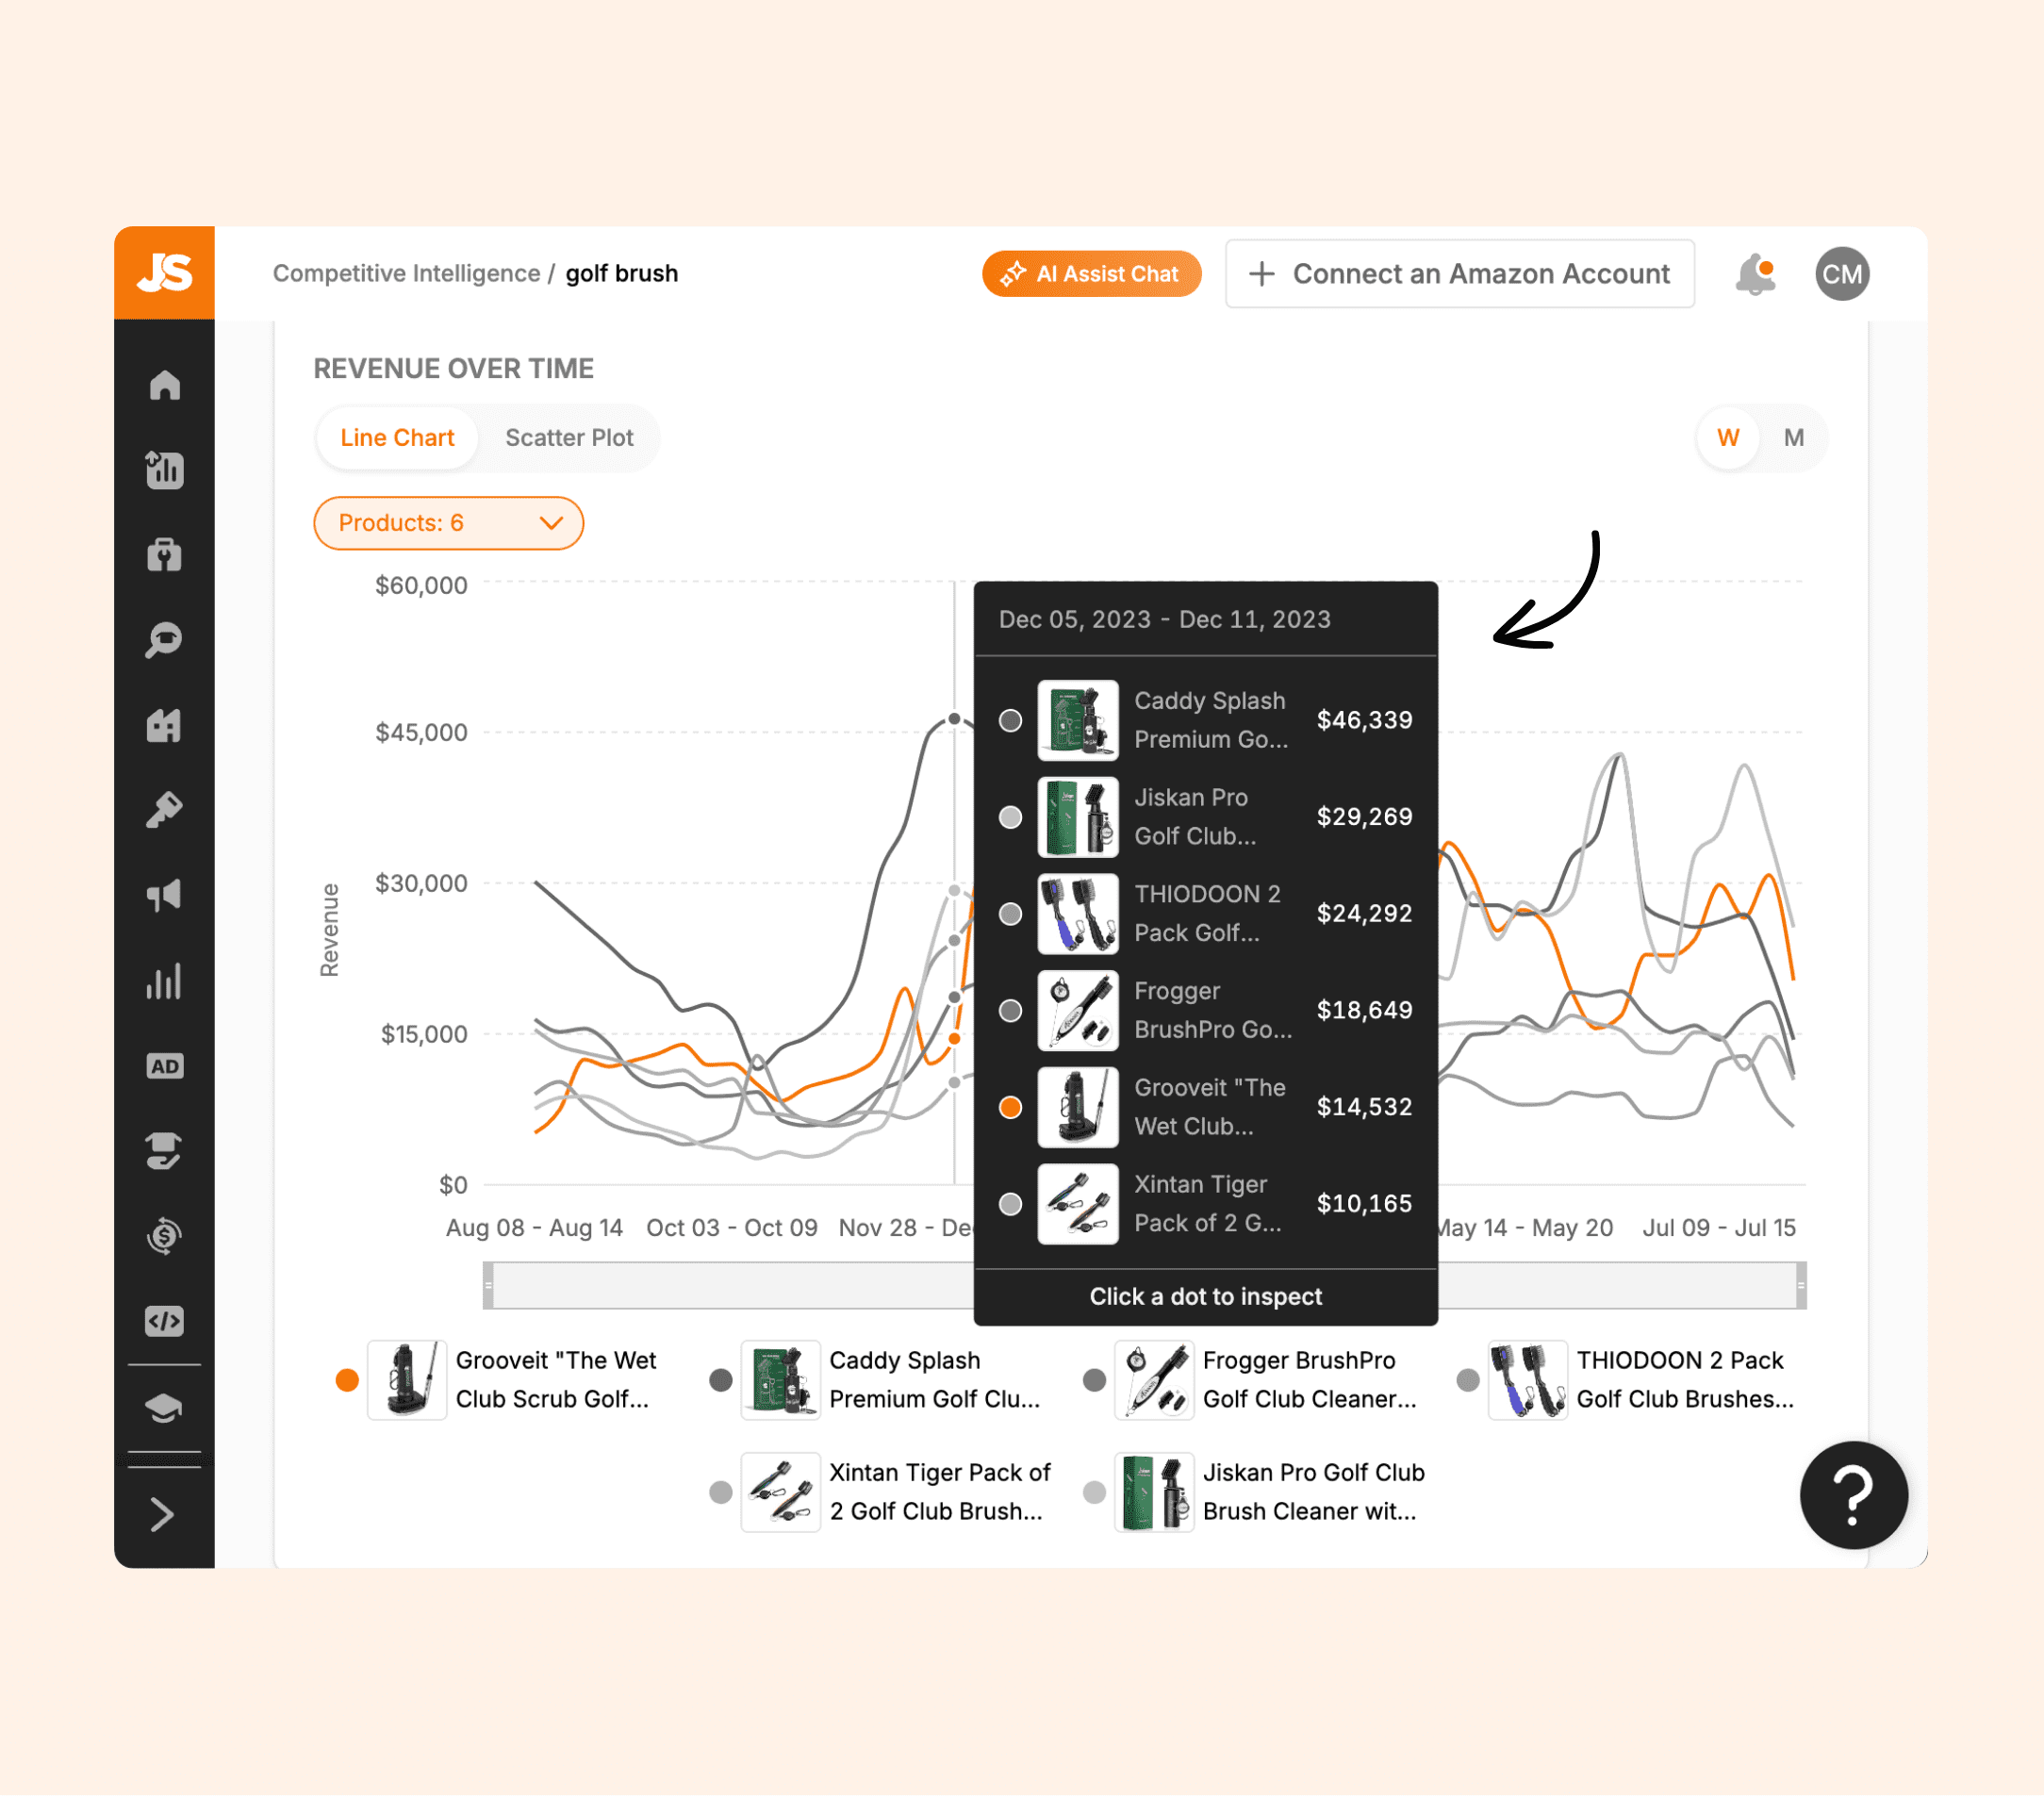
Detailed product comparisons
Callaway clearly dominates this category, but in early June, two brands overtook them. The detailed comparisons within the chart allow you to see how your product’s revenue, units sold, pricing, ratings, and reviews compare to the competition.
This information is beneficial for brand owners who are trying to gain more market share and grow revenue.
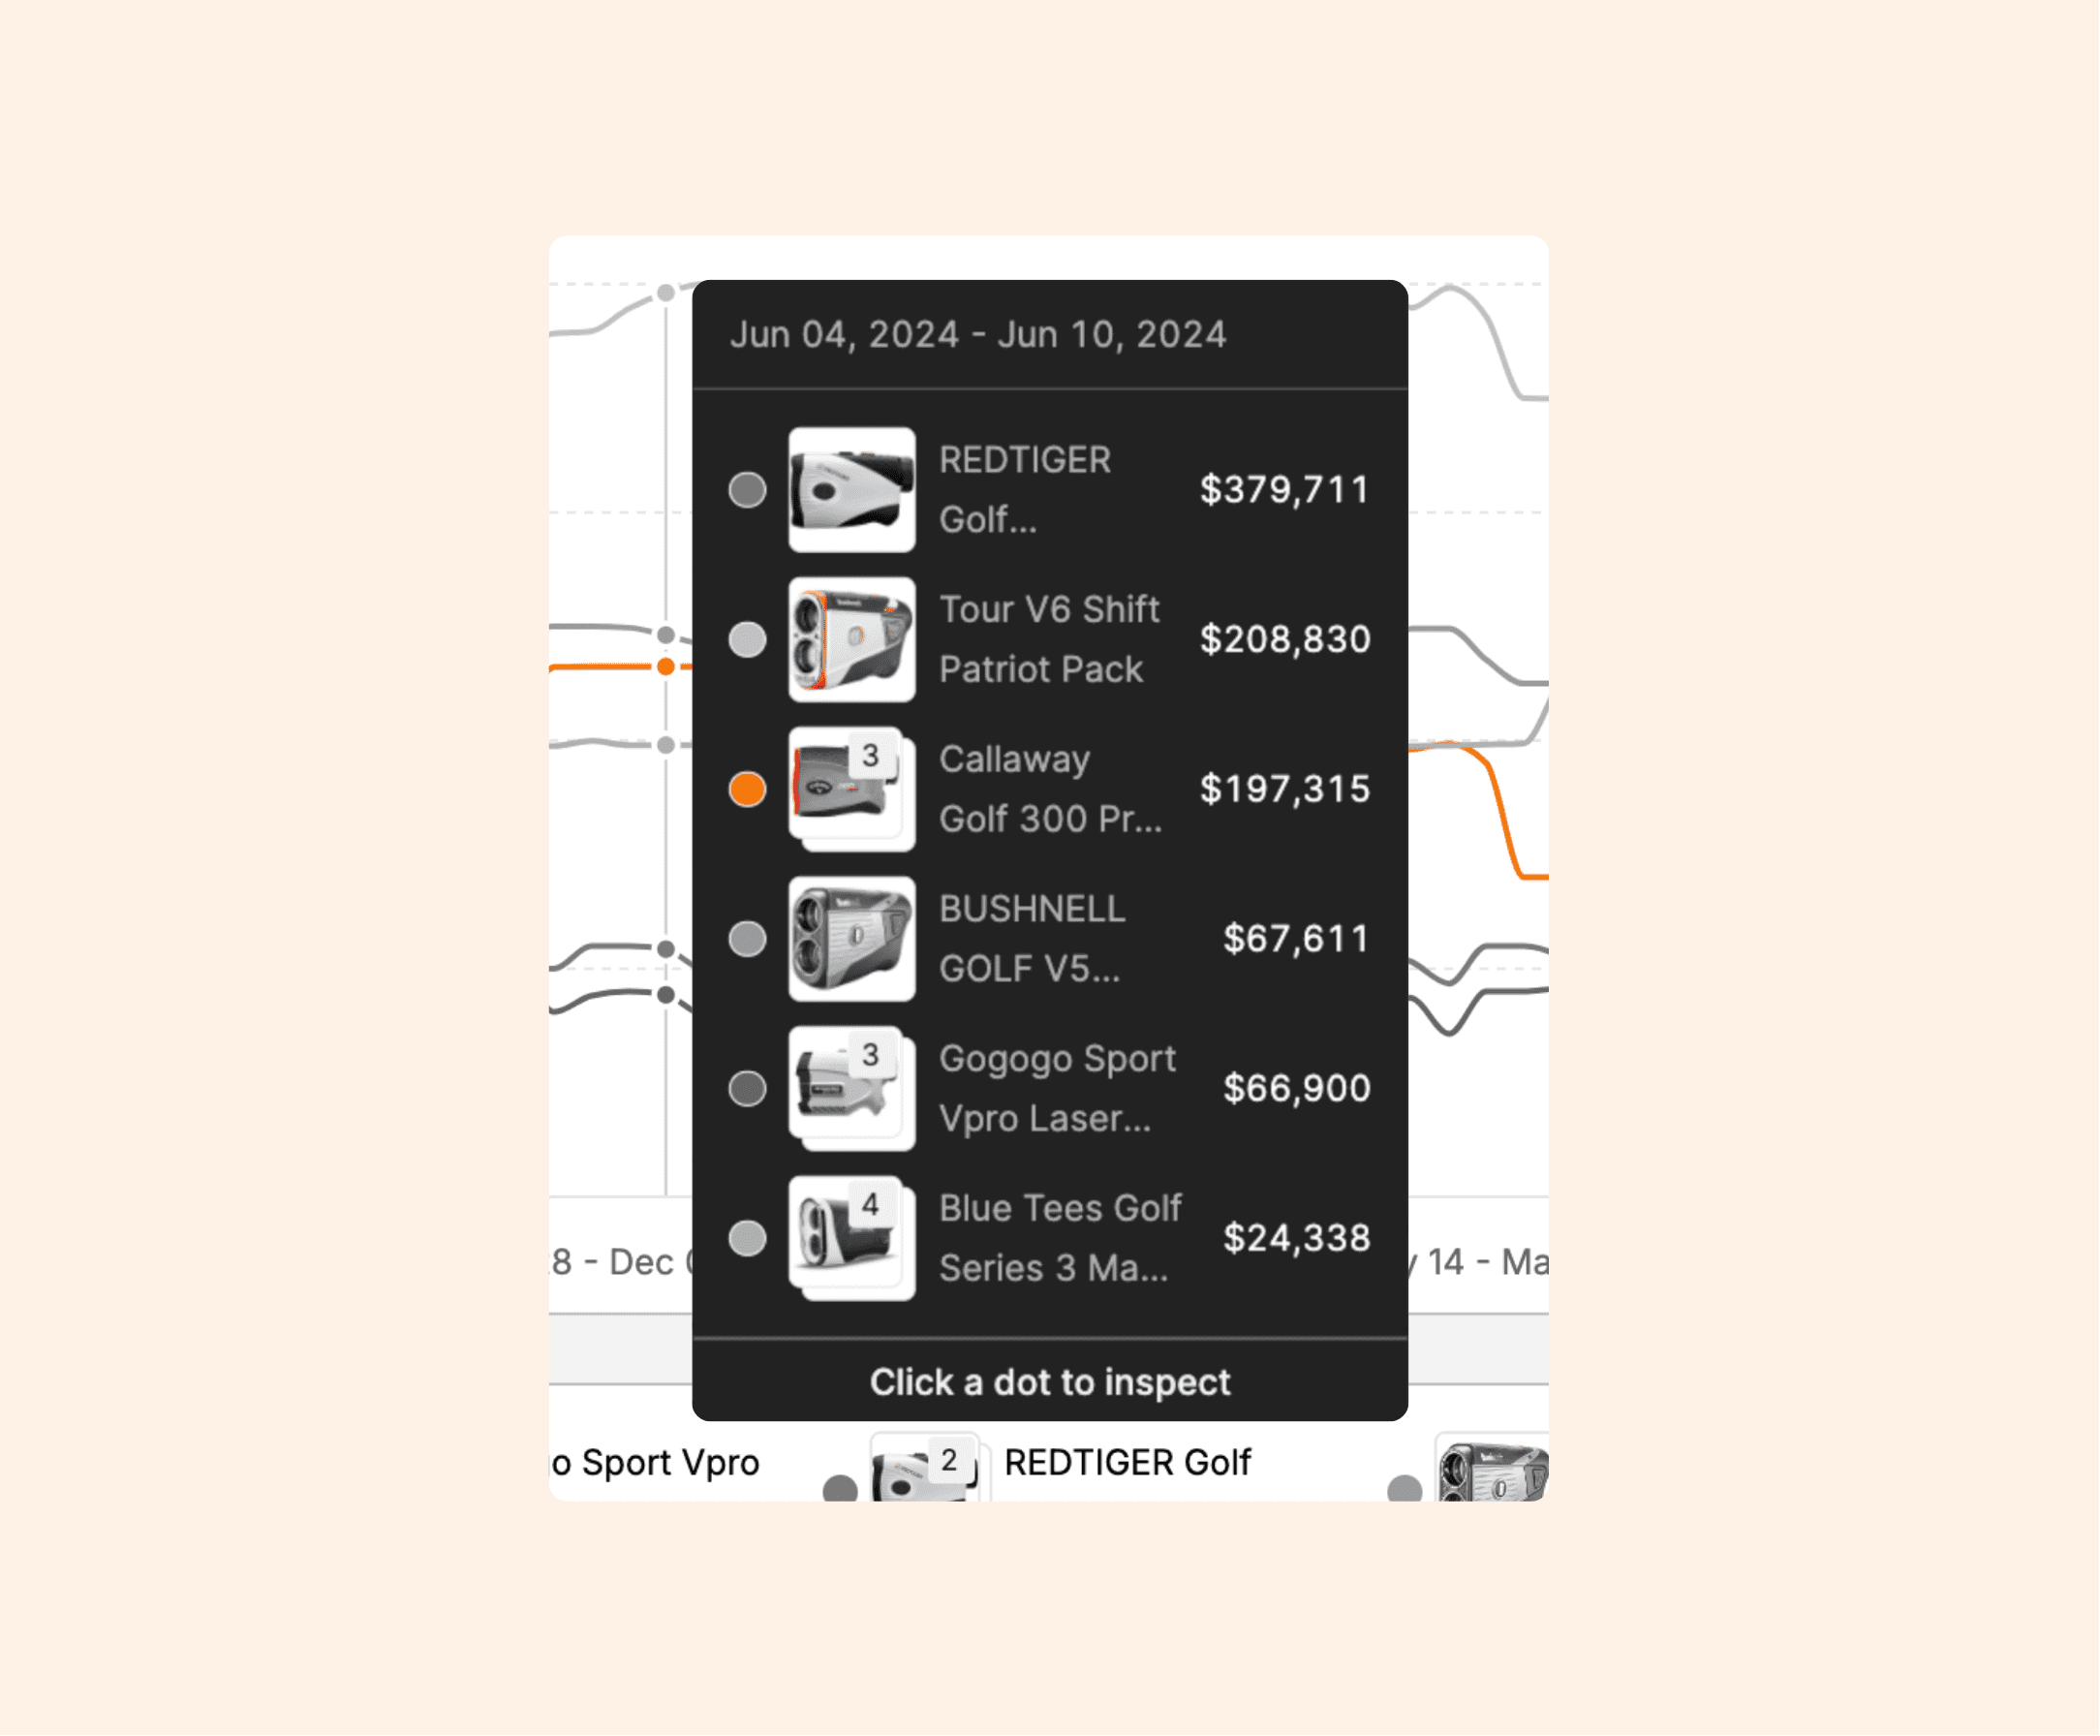
Again, click on one of the dots to view more information about a specific product.
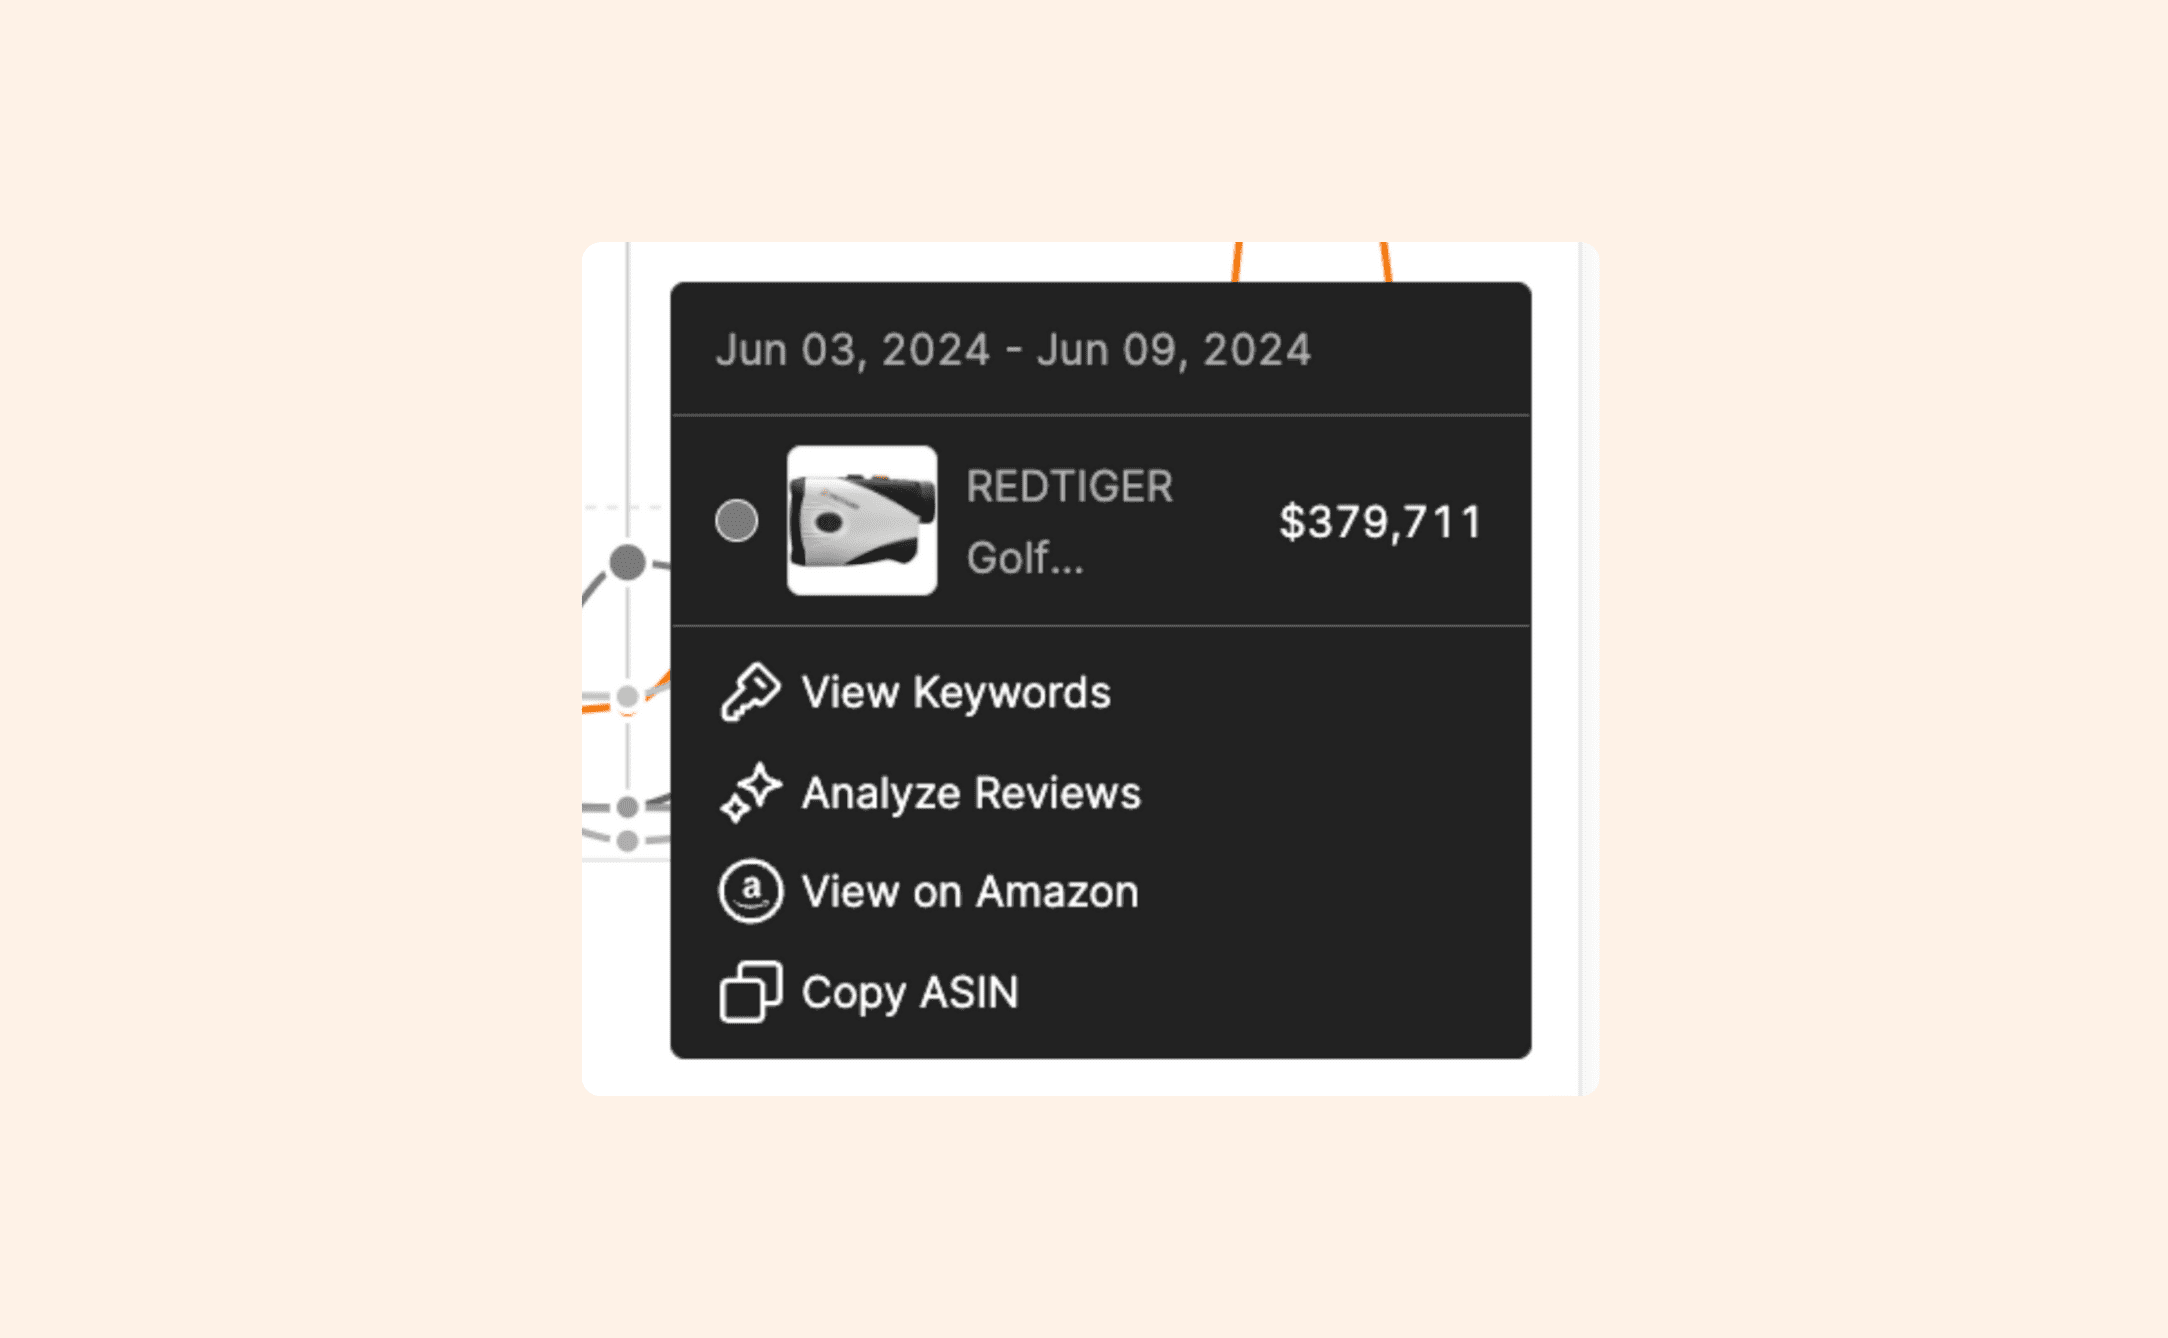
From there, you can view the keywords the product ranks for in Keyword Scout, analyze the reviews in AI Review Analysis, view the product on Amazon, or copy the ASIN.
View your closest competitors
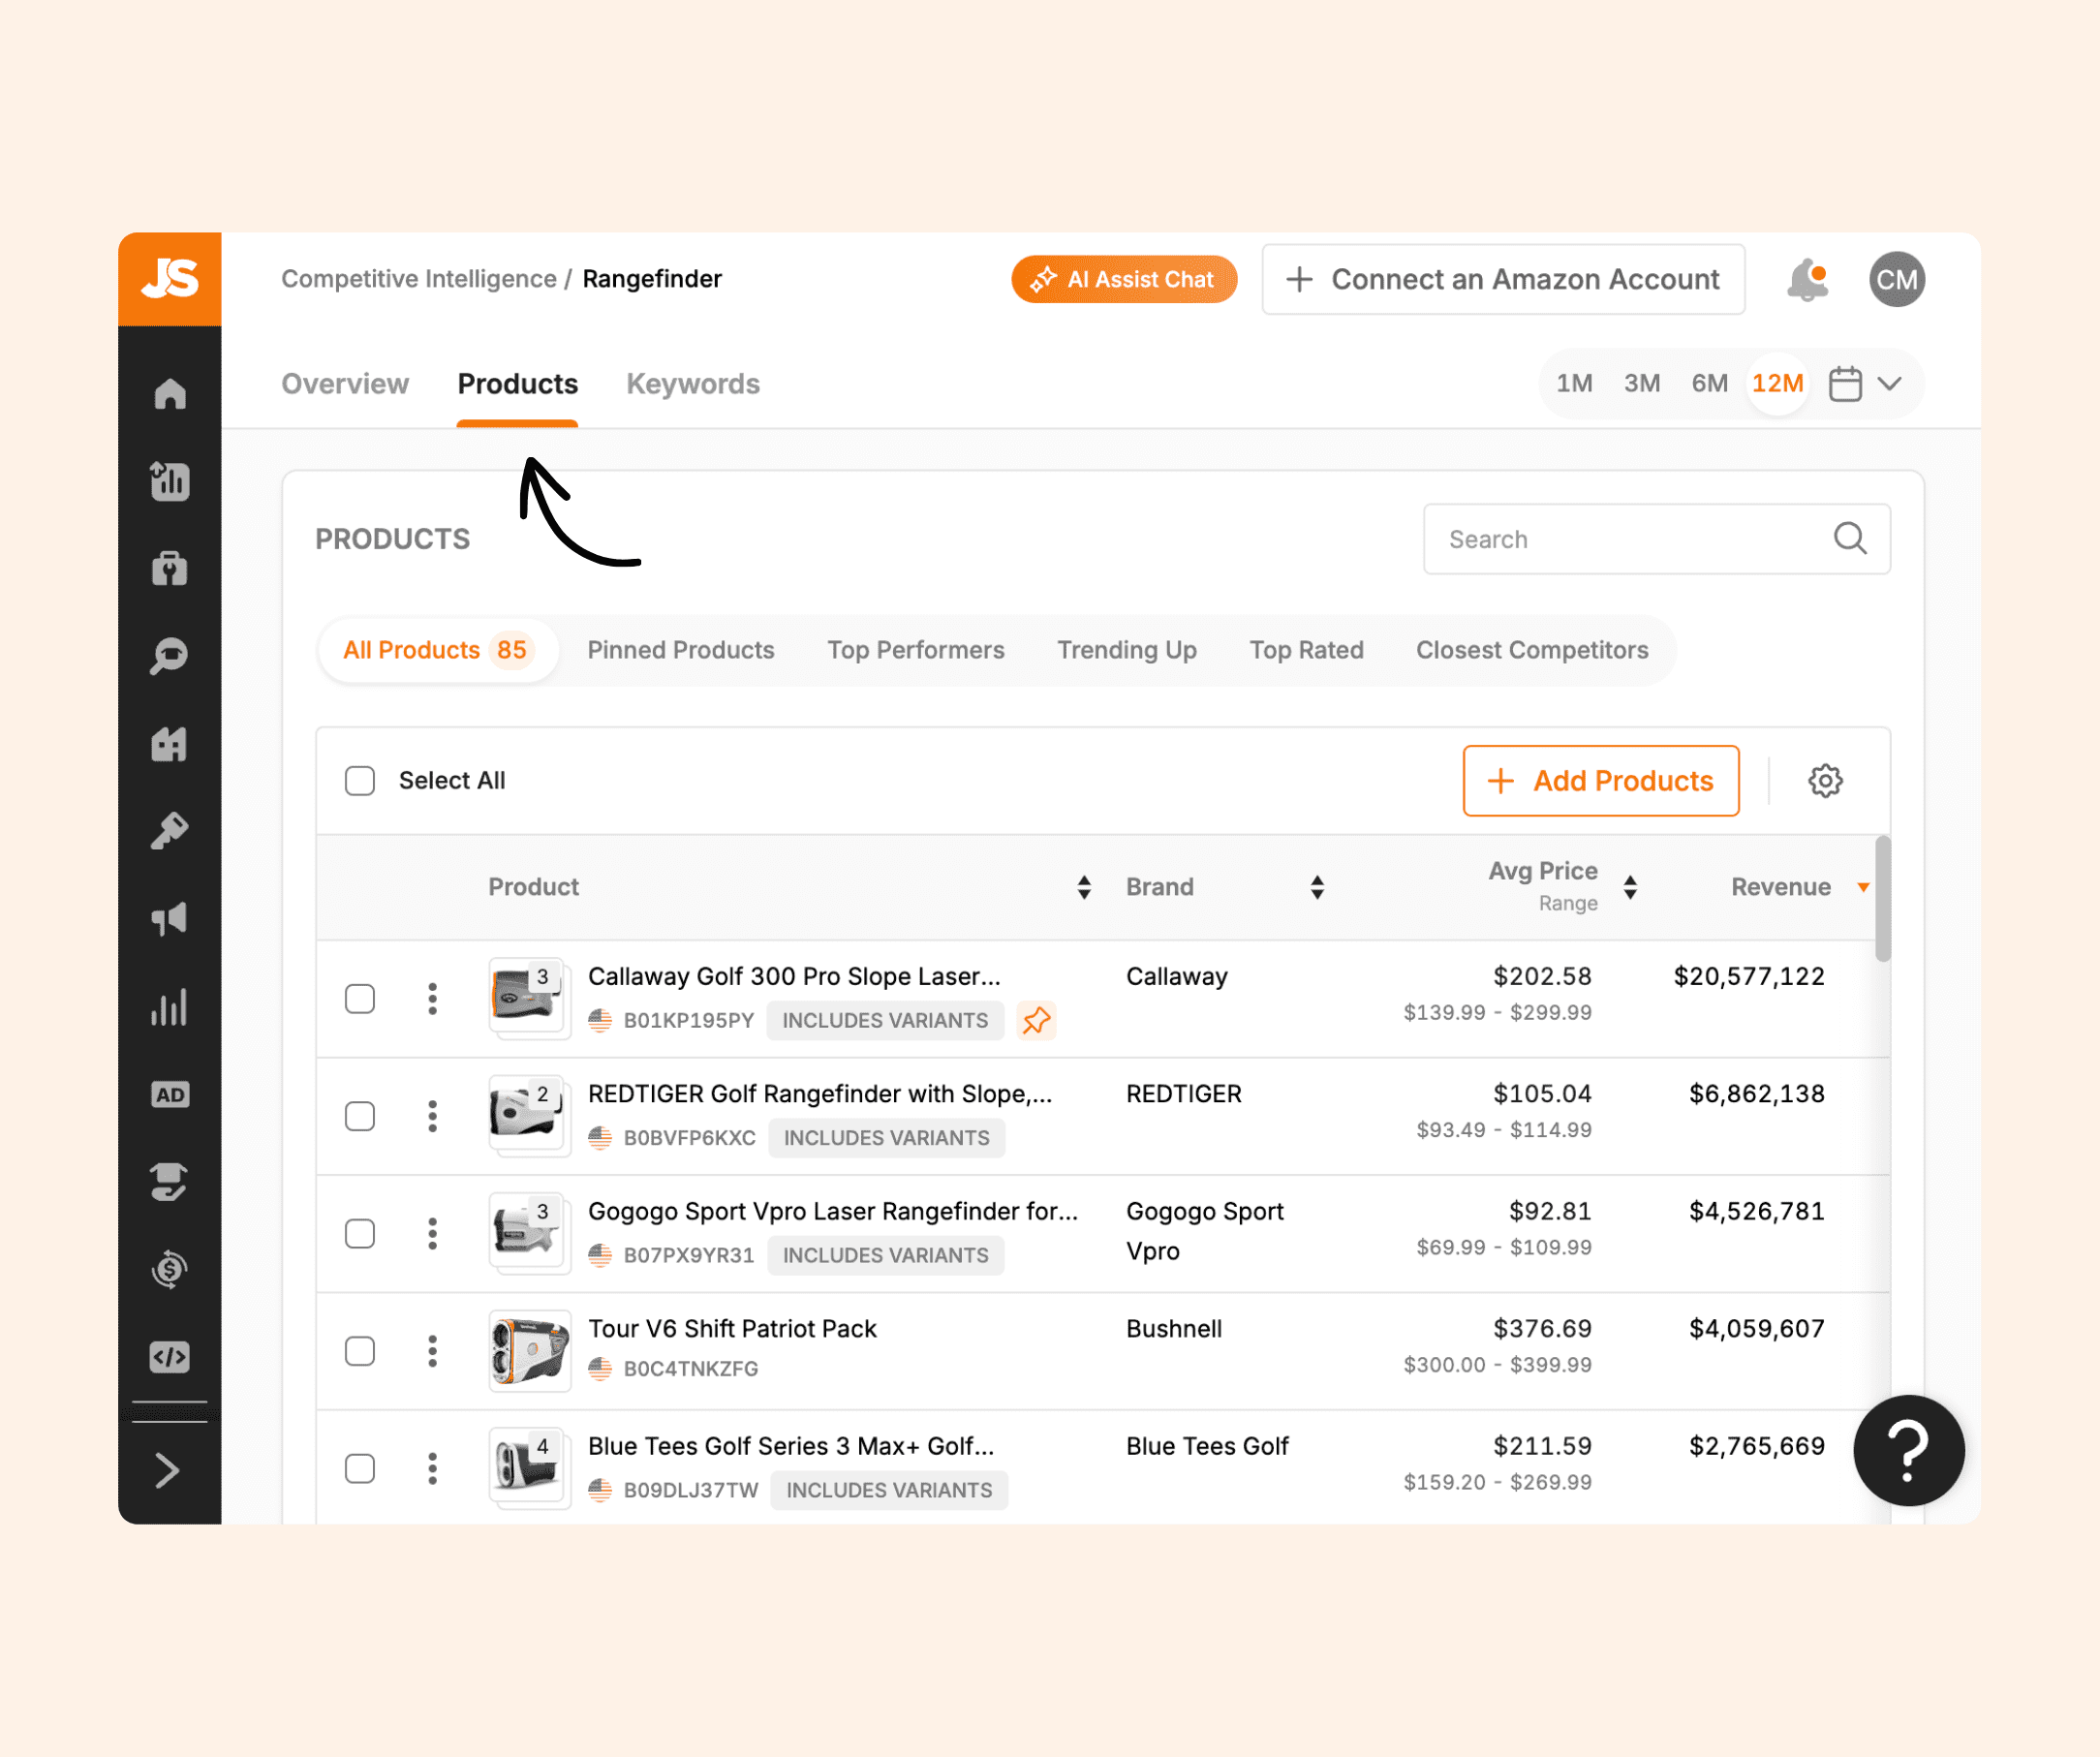
The products tab is next to the overview tab. Here, you can access a detailed table of all the products within the segment, with options to add or remove ASINs and “pin” specific ASINs for highlighted visibility across all charts.
You can also view the top performers, products trending up, top-rated products, and your closest competitors.
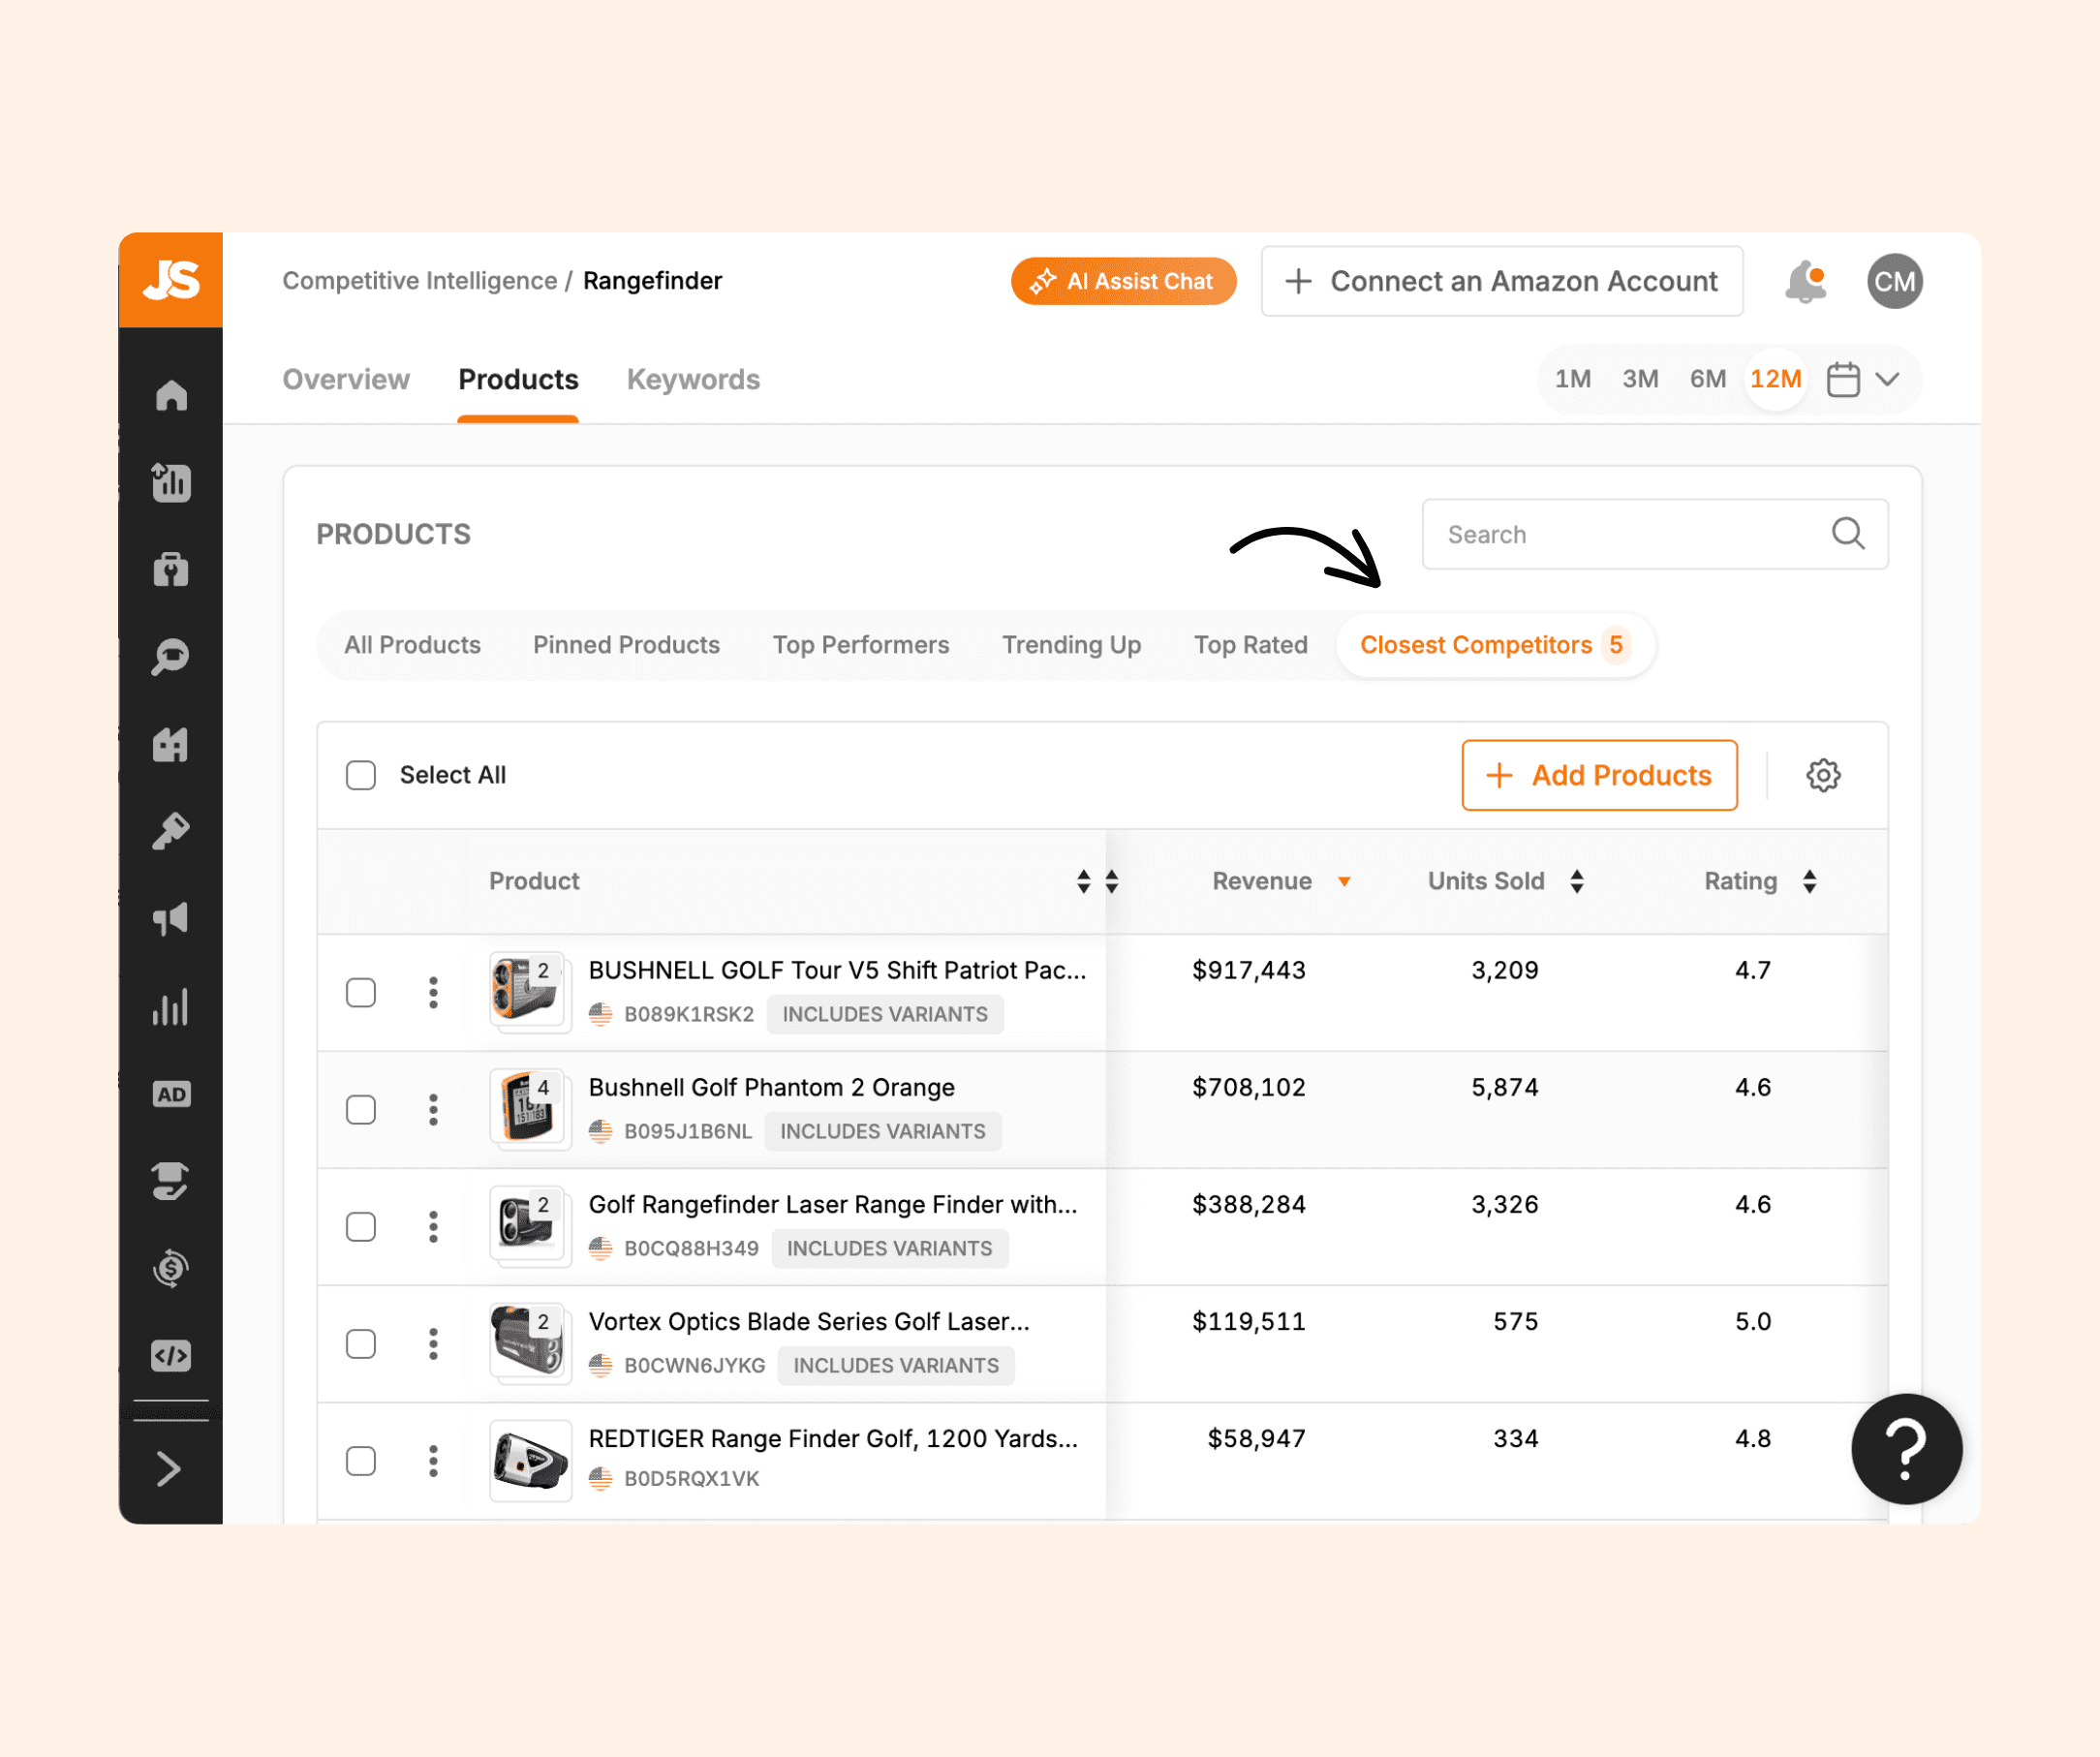
View metrics such as average price, revenue, units sold, rating, and number of reviews.
Evaluate seasonal trends
Analyzing seasonality is important when choosing a product to sell on Amazon. With Competitive Intelligence, you can view the revenue over time to view any fluctuations in sales month over month.
We’re looking at a golf product, so we can see that the most popular months are spring and summer; then, of course, the holiday season sees the biggest spike.
This product has some seasonality, but overall, it can be sold year-round. This information is good to know as you invest in new product launches.
In-depth keyword analysis
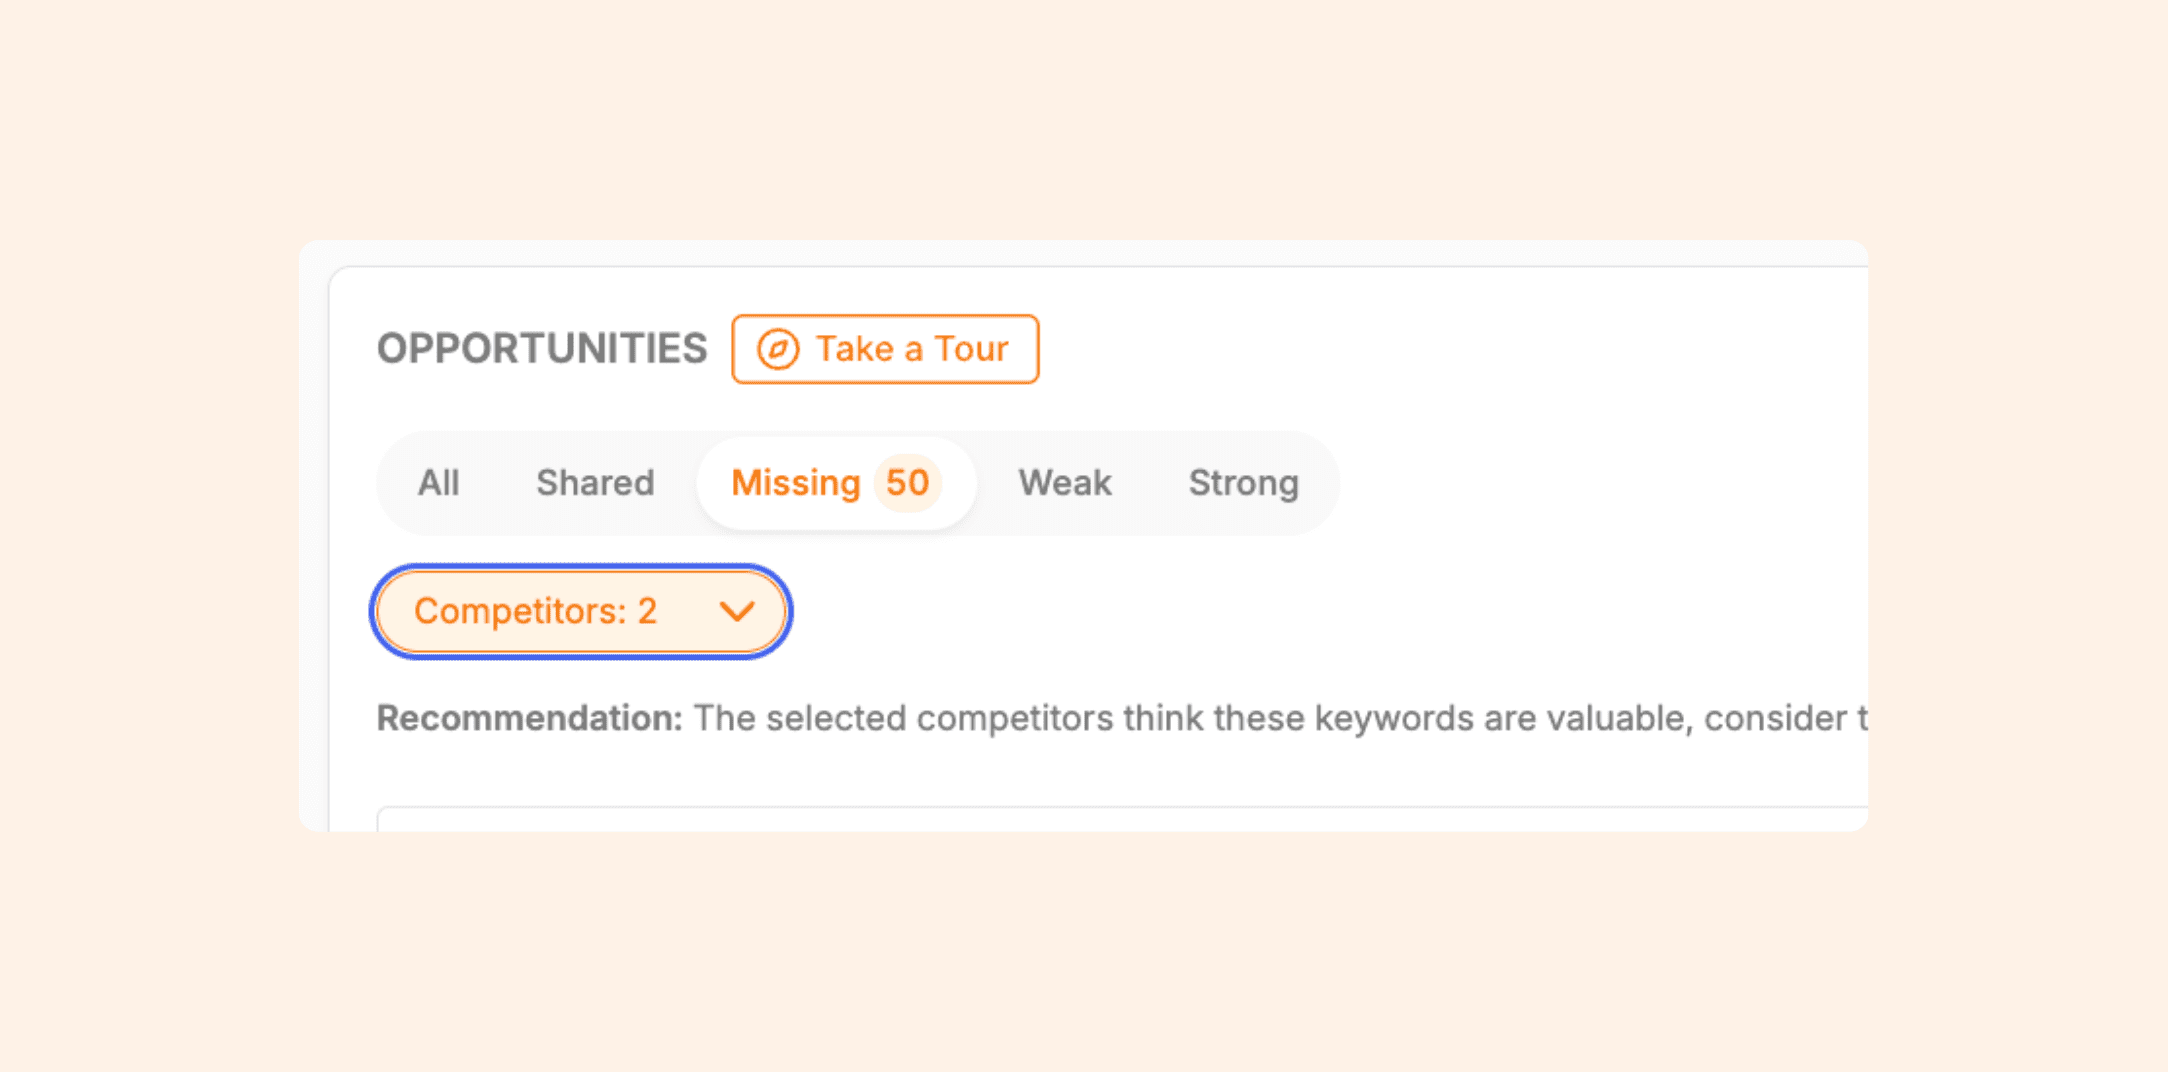
Under the keyword tab, users can identify the top keywords driving revenue for competitors, keywords your product is missing, areas where your products need work, and areas where your products are winning. You can also change the product for which you want to do keyword analysis.
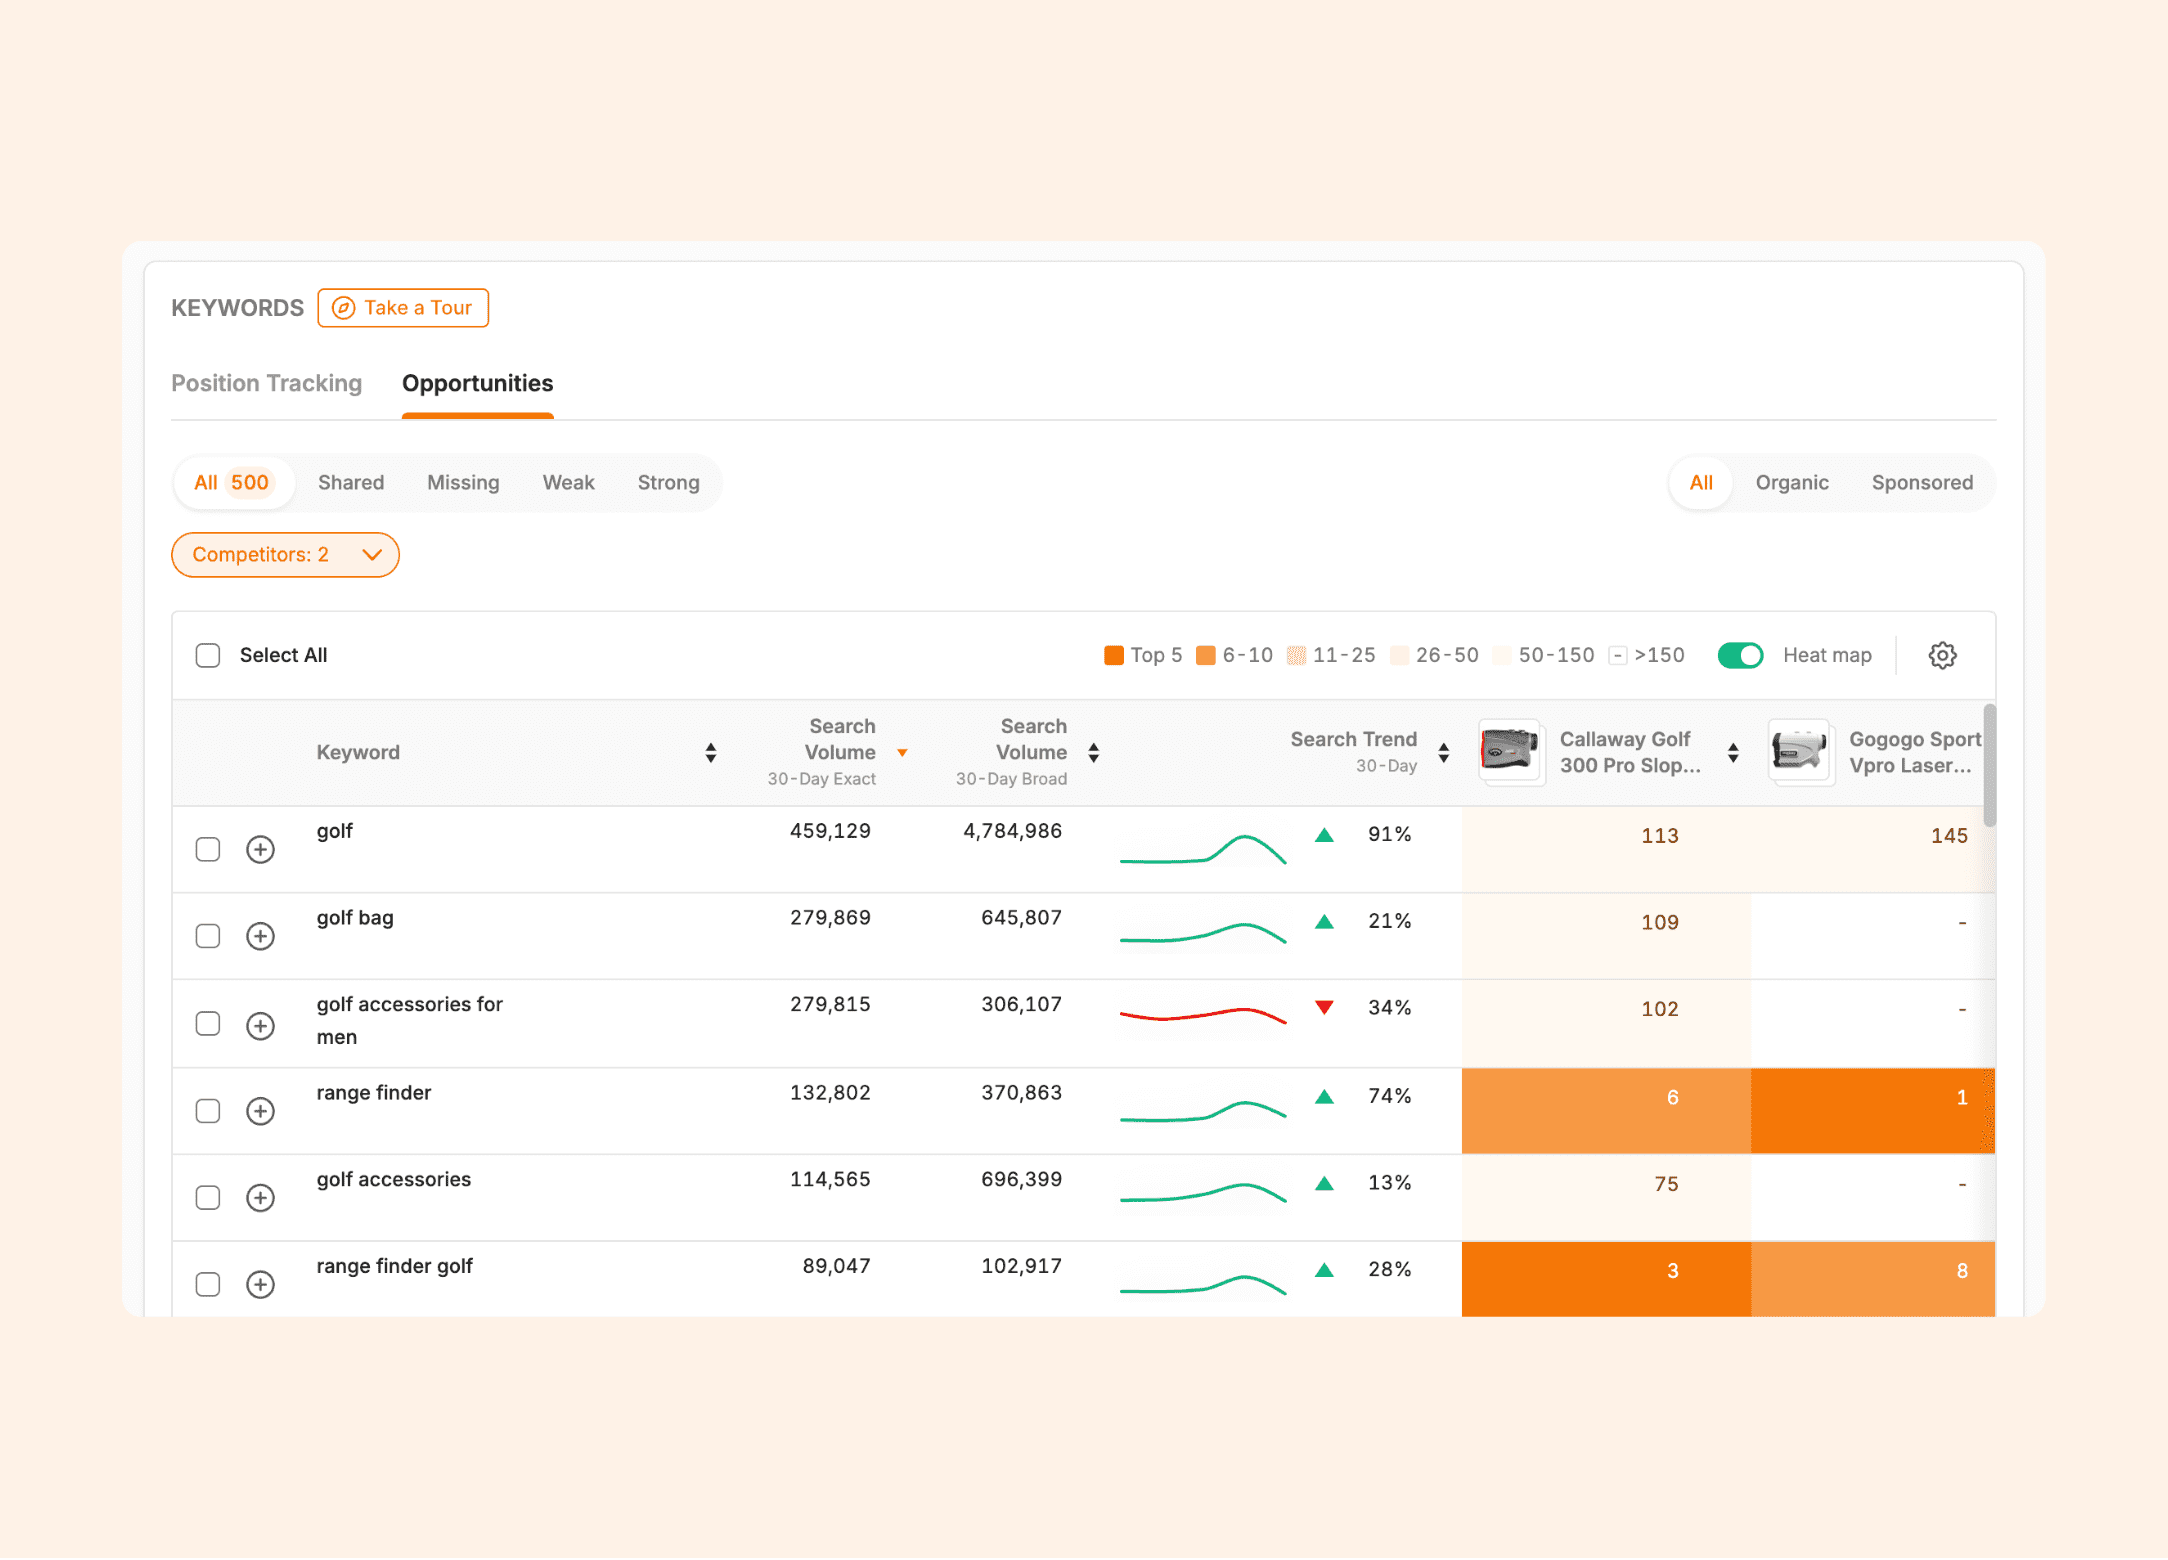
The most valuable tabs here are missing and weak. This identifies opportunities to target specific keywords that your competitors are targeting but for which you are not or are not ranking well.
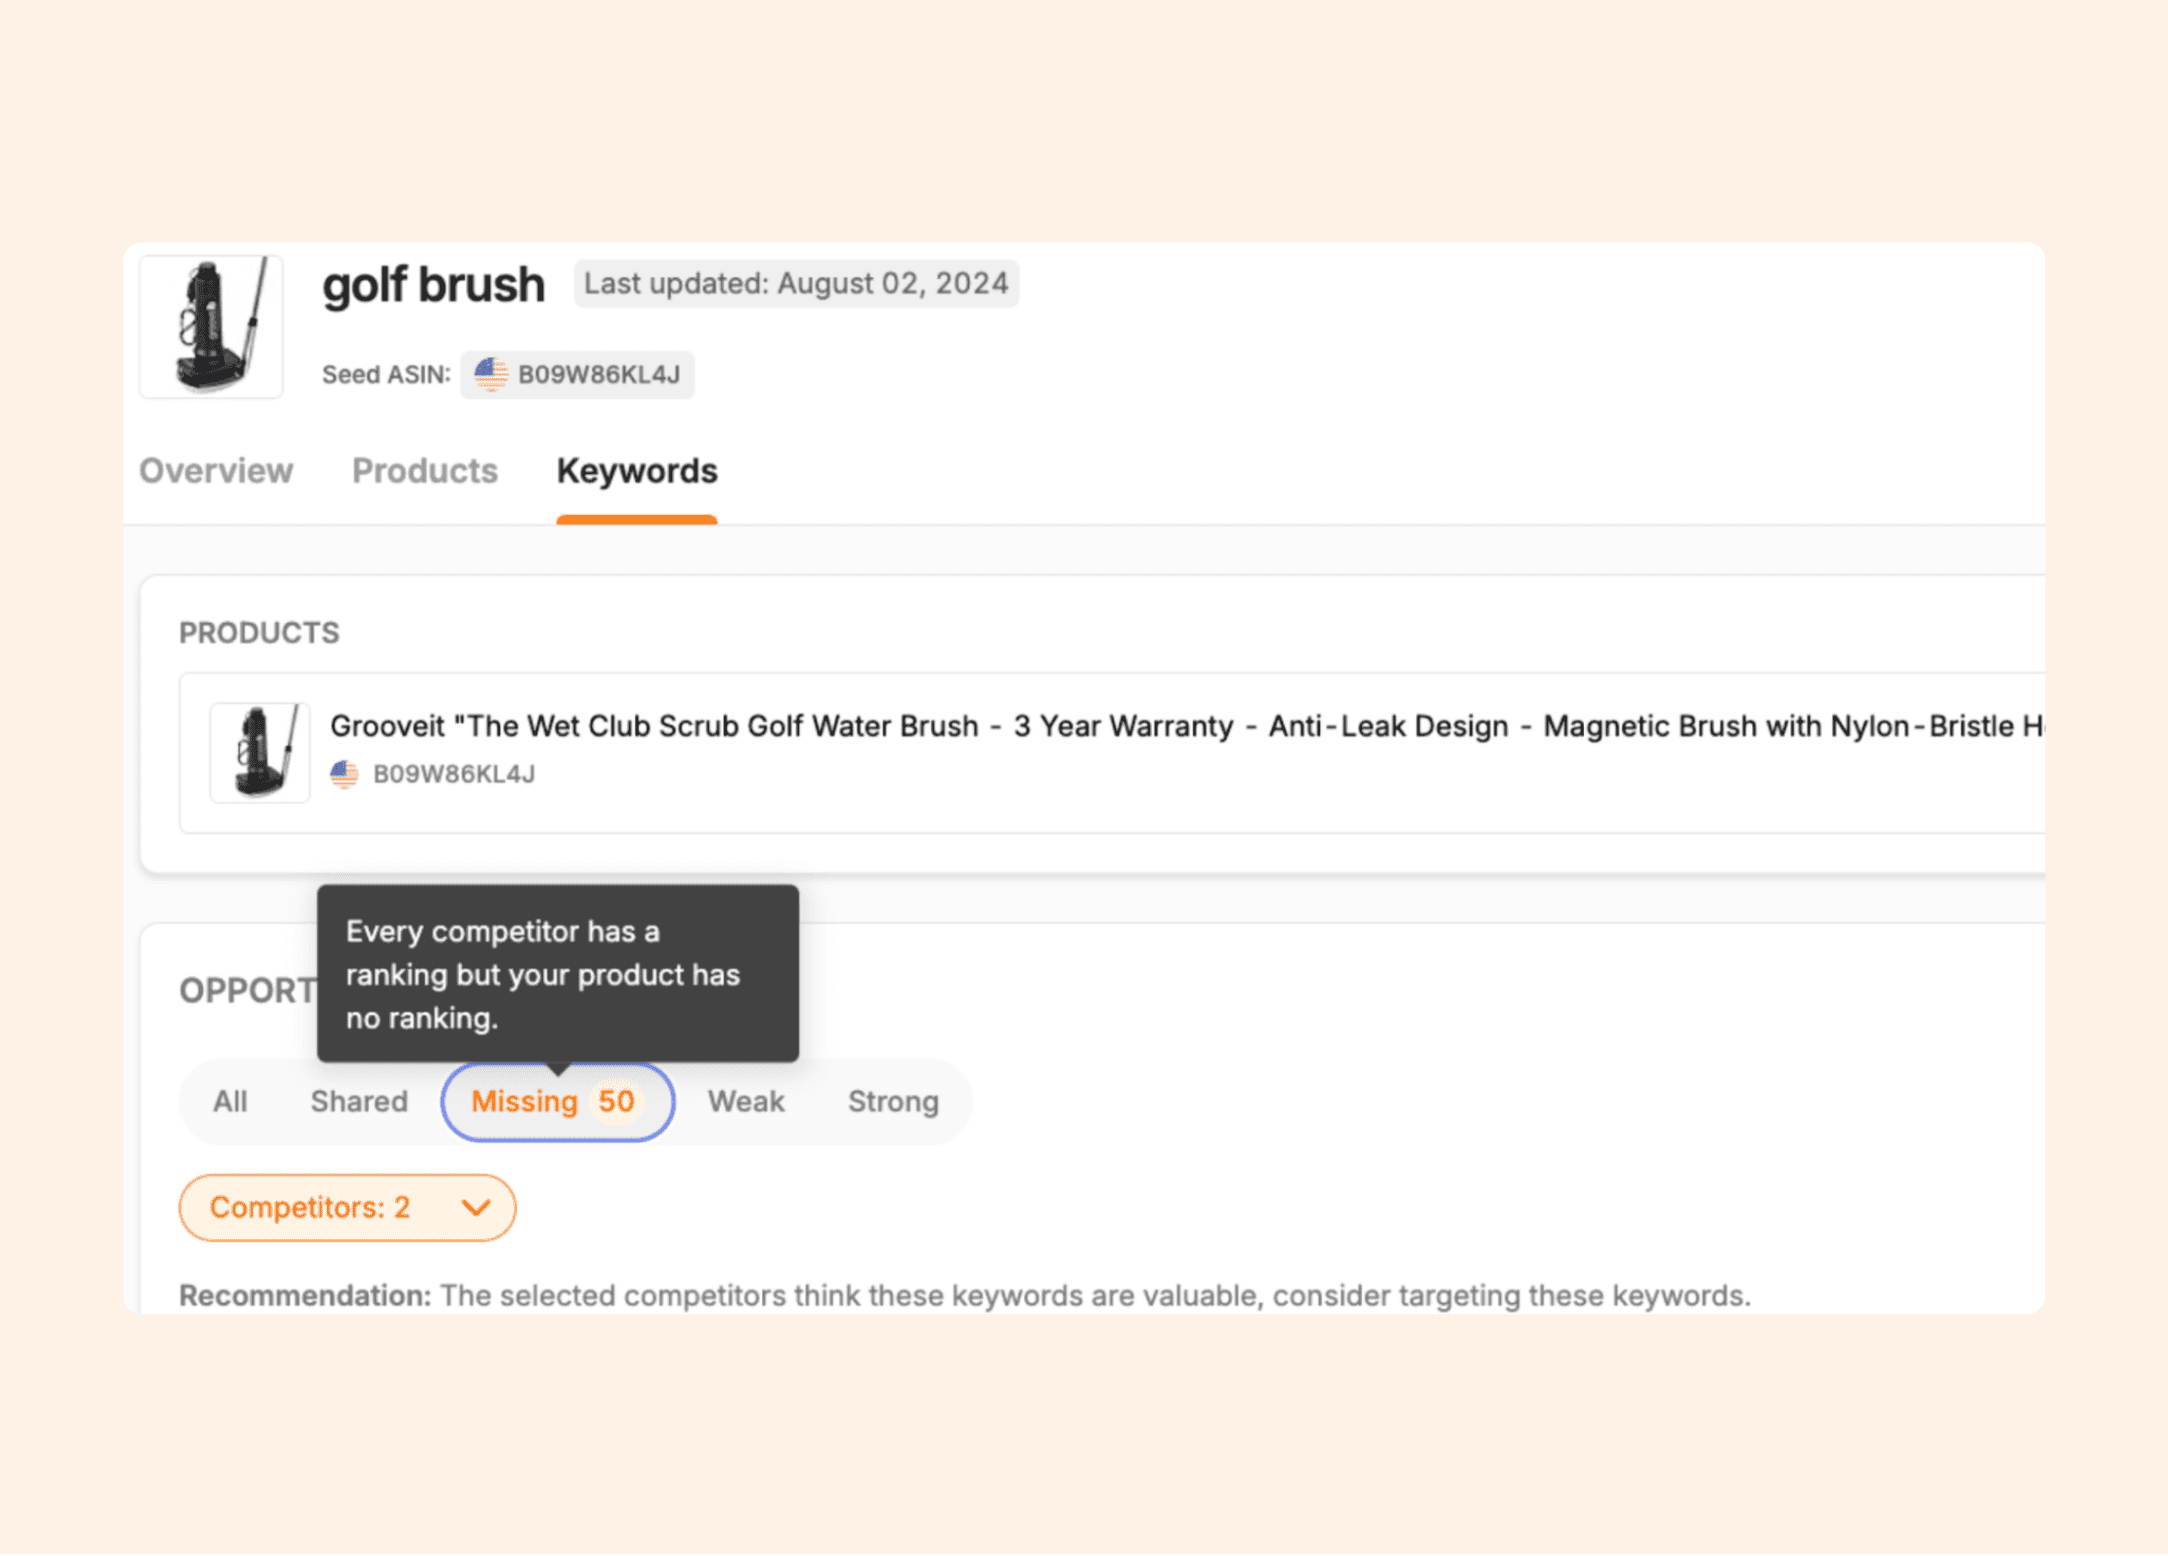
In this case, the product we’re looking at is missing 50 keywords—50 keywords that the competitors are ranking for, but my product is not. This is very powerful because it gives brands an opportunity to discover new keywords they’re not targeting within their listings and/or sponsored ad campaigns, which will then work to increase impressions and, hopefully, conversions.
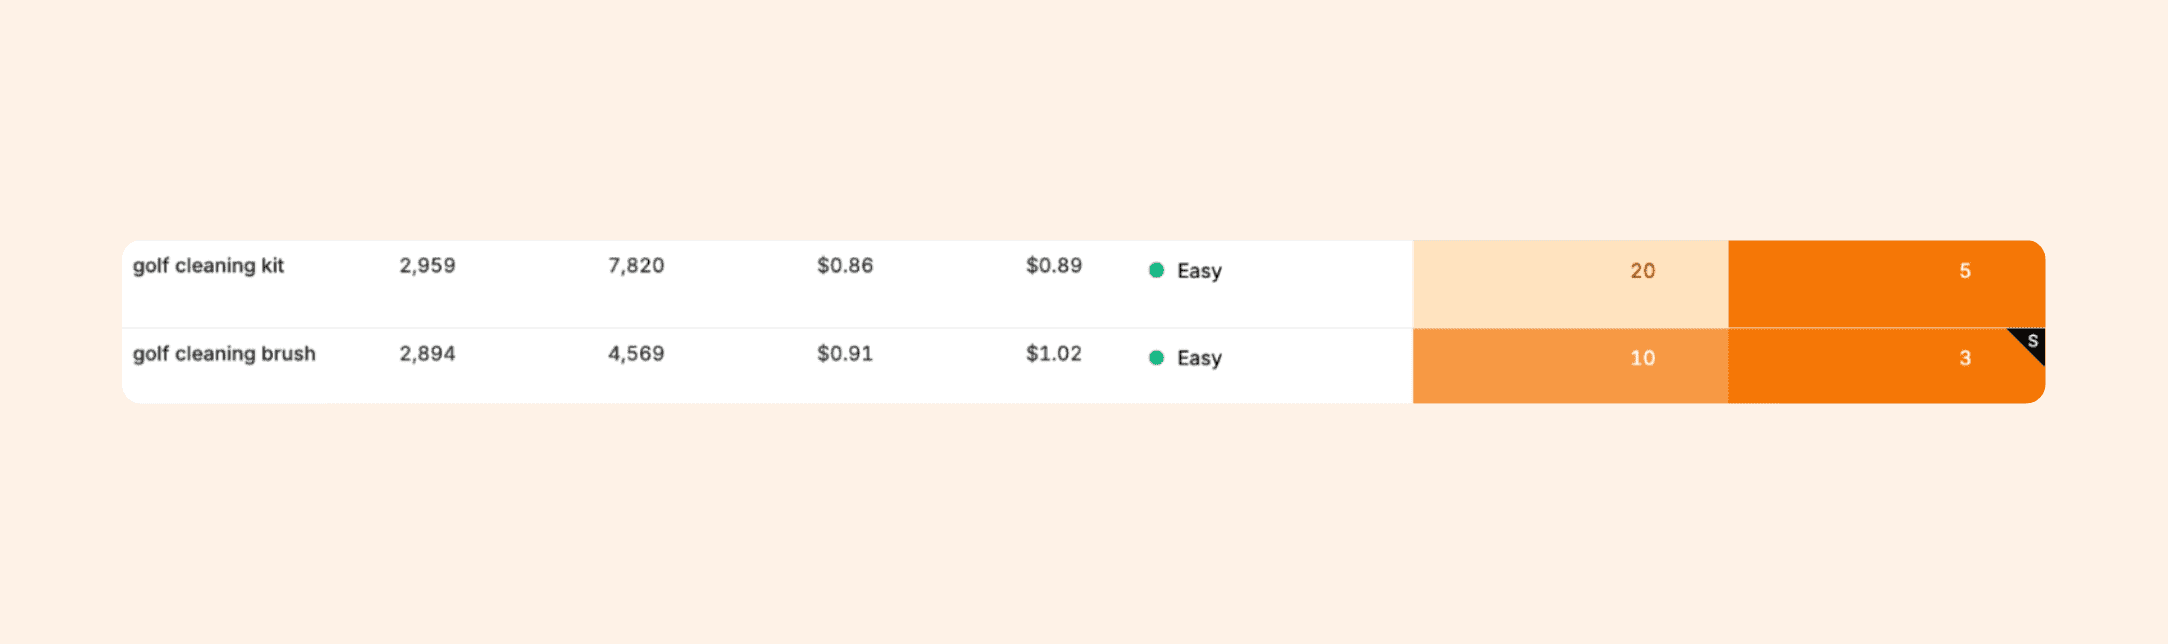
Looking at the weak tab, I can see that these two keywords are not ranking nearly as high as the competition. In this case, we should add them to our PPC campaigns or, if they are, increase the keyword bids so we can rank higher in search.
Based on the keyword volume and ease to rank, sellers can use this information to improve their organic and sponsored search rankings against their competitors.
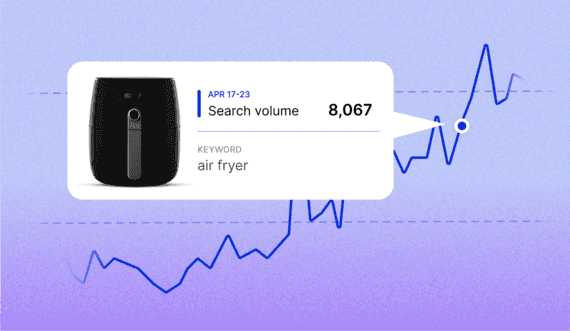
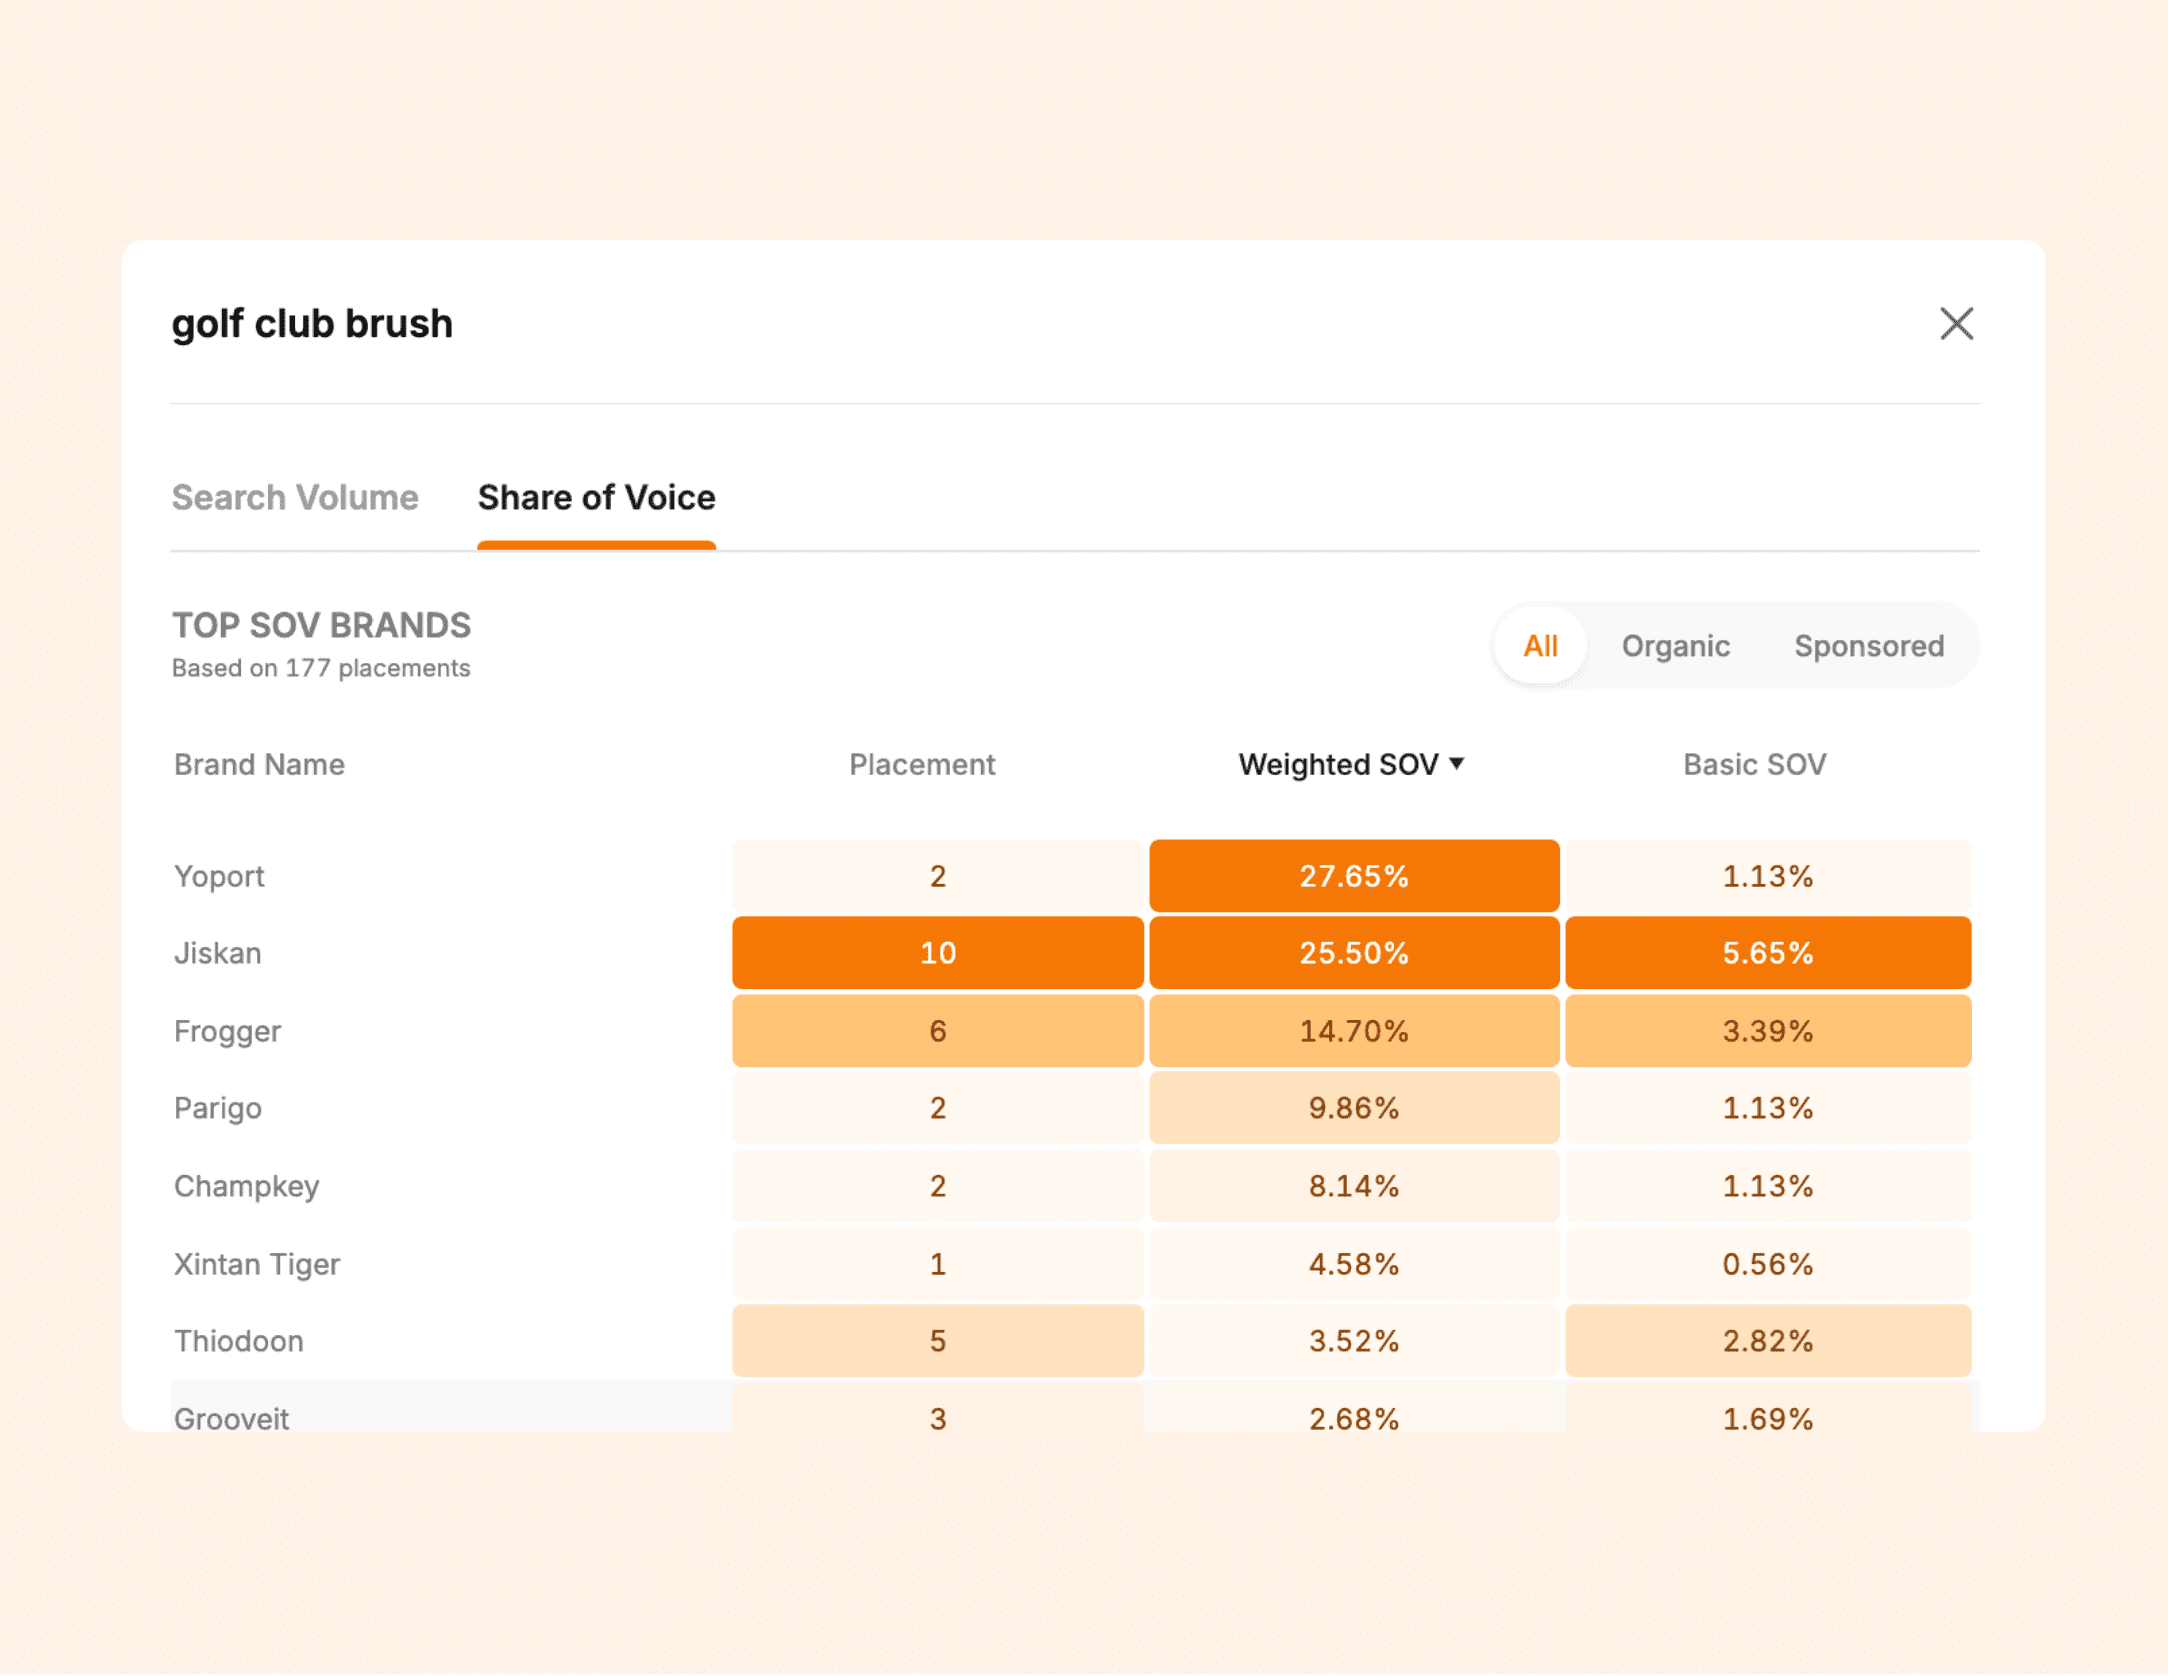
When you click on one of the keywords, a new window will open showing the search volume over time and the Share of Voice. The Share of Voice signifies which brands have the most visibility in the search results per keyword.
For instance, the brand Yoport has the highest SOV for the keyword “golf brush.” Our brand in this example is “Grooveit,” which only has a 2.68% SOV for the same keyword.
Knowing this information, we can work on increasing our visibility on the search results page for this relevant keyword by working on ranking higher organically and with sponsored ads.
Leverage Competitive Intelligence to grow your brand on Amazon
With Competitive Intelligence, you can benchmark your brand against your competitors, grow market share, increase keyword rankings, develop a new pricing strategy, and dominate your market on Amazon.
With features such as Share of Voice and keyword analysis, you can fully understand where your brand stands within the search results compared to competitors. Armed with that knowledge, you can work to improve your listings and increase your market share.
Grow your Amazon market share with cutting-edge Competitive Intelligence.
Brian Connolly is an Amazon seller, ecommerce expert, and writer for Jungle Scout. He lives in the New Jersey Shore area with his wife and cat. When he isn’t writing advice online for aspiring and experienced Amazon sellers for Jungle Scout, he spends his free time boating, fishing, and selling boating-themed items on his Amazon business.
Stay in the Amazon seller loop